emooki
HomePrice mapTransactions
🇬🇧 English🇫🇷 Français🇩🇪 Deutsch🇪🇸 Español🇮🇹 Italiano

Real estate price map


Real estate price map in the municipality of Estavar, choose a section to see transactions by parcel.

Pyrénées-Orientales (66)

Estavar - Real estate price m²

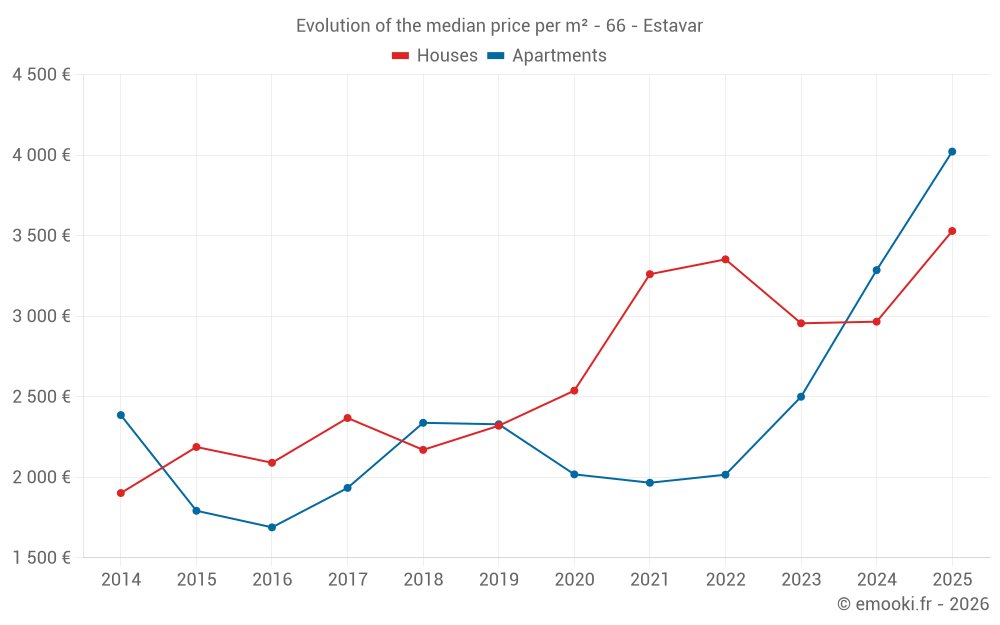
Median price of real estate
in the municipality of Estavar

HousesHouses
3 149  /m²
1-23-45-67-89-10
Reliability 7/10
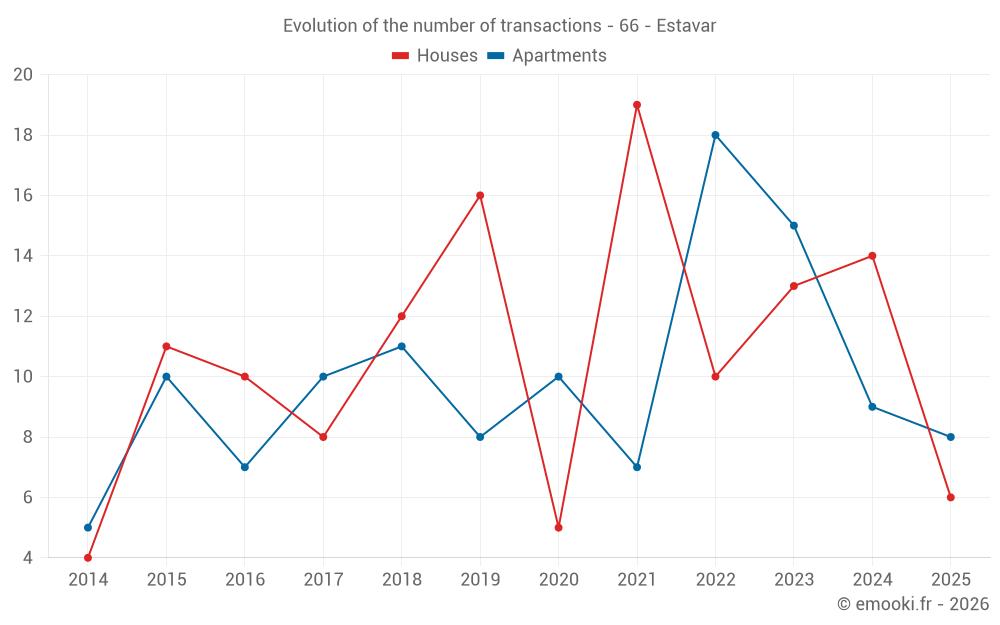
Median price on the 28 transactions of the last 24 months.
from 2 520 to
4 205  /m²
60% of transactions from the 2nd to the 8th deciles.
ApartmentsApartments
3 008  /m²
1-23-45-67-89-10
Reliability 7/10
Median price on the 23 transactions of the last 24 months.
from 2 373 to
4 527  /m²
60% of transactions from the 2nd to the 8th deciles.
DwellingsDwellings
3 462  /m²
1-23-45-67-89-10
Reliability 8/10
Median price on the 26 transactions of the last 12 months.
from 2 713 to
4 914  /m²
60% of transactions from the 2nd to the 8th deciles.
HousesEvolution of the price per m² of houses since...
1 year
+19%
2 years
+19%
3 years
+5.2%
4 years
+8.2%
5 years
+39%
6 years
+52%
7 years
+63%
8 years
+49%
9 years
+69%
10 years
+61%
11 years
+86%
ApartmentsEvolution of the price per m² of apartments since...
1 year
+22%
2 years
+61%
3 years
+100%
4 years
+105%
5 years
+99%
6 years
+73%
7 years
+72%
8 years
+108%
9 years
+138%
10 years
+124%
11 years
+69%

Yearly evolution

Evolution of the median price per m²

Evolution of the median price per m² - 66 - Estavar

Evolution of the number of transactions

Warning, last year incomplete. Projections made based on the proportions between semesters of the previous year at the departmental/national level and by type of property.

Evolution of the number of transactions - 66 - Estavar

Yearly data

Descending order
Year
Houses
house
transactions
Houses
house
Price per m²
Apartments
apt.
transactions
Apartments
apt.
Price per m²
2025
6
3 529 
8
4 022 
2024
14
2 966 
9
3 286 
2023
13
2 956 
15
2 500 
2022
10
3 353 
18
2 016 
2021
19
3 261 
7
1 966 
2020
5
2 538 
10
2 018 
2019
16
2 320 
8
2 329 
2018
12
2 170 
11
2 338 
2017
8
2 368 
10
1 934 
2016
10
2 090 
7
1 689 
2015
11
2 188 
10
1 792 
2014
4
1 902 
5
2 386 

Analysis

Structure of prices per m²

Values of price percentiles per m² over the periods used for the estimated price of each type of property.

Structure of transaction amounts

Values of transaction amounts percentiles over the periods used for the estimated price of each type of property.

Transaction amounts and prices per m² by percentile

Ascending order
Percentile
Houses
house
Price per m²
Houses
house
Transaction amount
Apartments
apt.
Price per m²
Apartments
apt.
Transaction amount
10th percentile
2 000 
141 K
1 610 
86 400 
20th percentile
2 520 
252 K
2 373 
102 K
30th percentile
2 934 
266 K
2 748 
112 K
40th percentile
3 032 
273 K
2 881 
135 K
50th percentile
3 149 
289 K
3 008 
180 K
60th percentile
3 408 
311 K
3 345 
207 K
70th percentile
3 685 
320 K
3 725 
271 K
80th percentile
4 205 
355 K
4 527 
298 K
90th percentile
4 674 
376 K
5 295 
318 K

National and departmental comparison

Evolution of the median price per m² of houses

Evolution of the median price per m² of apartments

Quarterly evolution

Evolution of the median price per m²

Evolution of the number of transactions

Quarterly data

Descending order
Quarter
Houses
house
transactions
Houses
house
Price per m²
Apartments
apt.
transactions
Apartments
apt.
Price per m²
2025 Q2
3
4 765 
6
4 022 
2025 Q1
3
3 368 
2
4 116 
2024 Q4
3
3 566 
4
3 282 
2024 Q3
5
2 931 
0
--- 
2024 Q2
3
3 000 
4
3 436 
2024 Q1
3
2 582 
1
2 772 
2023 Q4
4
4 197 
4
2 198 
2023 Q3
4
3 114 
2
3 402 
2023 Q2
2
2 742 
1
1 986 
2023 Q1
3
2 633 
8
2 179 
2022 Q4
5
3 506 
4
2 358 
2022 Q3
2
2 882 
6
2 726 
2022 Q2
0
--- 
5
1 833 
2022 Q1
3
4 769 
3
1 553 
2021 Q4
6
3 323 
5
1 966 
2021 Q3
8
3 765 
0
--- 
2021 Q2
3
2 667 
2
1 532 
2021 Q1
2
2 520 
0
--- 
2020 Q4
2
2 282 
4
1 990 
2020 Q3
1
1 521 
1
696 
2020 Q2
1
3 188 
3
2 264 
2020 Q1
1
2 538 
2
2 174 
2019 Q4
3
1 682 
2
2 364 
2019 Q3
6
2 320 
1
3 016 
2019 Q2
1
521 
2
2 174 
2019 Q1
6
3 146 
3
2 289 
2018 Q4
3
2 545 
3
3 038 
2018 Q3
3
1 736 
0
--- 
2018 Q2
2
2 166 
7
2 155 
2018 Q1
4
2 204 
1
2 547 
2017 Q4
2
2 514 
4
1 080 
2017 Q3
3
2 354 
1
2 100 
2017 Q2
0
--- 
2
3 038 
2017 Q1
3
2 000 
3
1 769 
2016 Q4
4
2 014 
2
1 702 
2016 Q3
2
3 725 
1
1 583 
2016 Q2
3
1 791 
2
1 806 
2016 Q1
1
1 938 
2
1 965 
2015 Q4
3
2 580 
5
2 213 
2015 Q3
4
2 188 
3
1 660 
2015 Q2
3
2 154 
0
--- 
2015 Q1
1
1 148 
2
1 784 
2014 Q4
1
1 257 
3
2 544 
2014 Q3
1
1 889 
0
--- 
2014 Q2
1
1 915 
0
--- 
2014 Q1
1
2 138 
2
2 072 

Overview of the latest real estate transactions

The following list is an anonymized overview of the latest transactions. For more details and to find all transactions, please use the map to view transactions by plot or the transaction search page for a search by criteria.

2025-06-27
85 500 
2 948  /m²(29 m²)
Sale
Apartments
Apartment
3 rooms
29 m2
3 outbuildings
2025-06-20
370 000 
4 933  /m²(75 m²)
Sale
Houses
House
5 rooms
75 m2
2025-06-18
133 500 
1 376  /m²(97 m²)
Sale
Apartments
Apartment
2 rooms
97 m2
2025-05-16
307 200 
5 486  /m²(56 m²)
Sale
Apartments
Apartment
3 rooms
56 m2
1 outbuilding
2025-05-15
132 000 
Sale
Land
868 m2
-Terrains à bâtir
2025-04-30
265 000 
5 096  /m²(52 m²)
Sale
Apartments
Apartment
3 rooms
52 m2
2 outbuildings
2025-04-30
355 200 
3 116  /m²(114 m²)
Sale
Houses
House
3 rooms
114 m2
2025-04-30
262 080 
4 765  /m²(55 m²)
Sale
Houses
House
3 rooms
55 m2
Land
201 m2
-Landes
2025-04-25
410 000 
6 833  /m²(60 m²)
Sale
Apartments
Apartment
4 rooms
60 m2
1 outbuilding
2025-04-23
249 600 
transaction.nature.Vente terrain à bâtir
Land
3830 m2
-Terres
2025-04-12
8 000 
Sale
1 outbuilding
2025-04-04
201 993 
1 262  /m²(160 m²)
Sale
Apartments
Apartment
6 rooms
160 m2
Land
6826 m2
-Terres
2025-03-21
273 600 
3 040  /m²(90 m²)
Sale
Houses
House
5 rooms
90 m2
2025-03-07
310 000 
3 690  /m²(84 m²)
Sale
Houses
House
4 rooms
84 m2
Land
491 m2
-Sols
2025-02-03
200 000 
1 389  /m²(144 m²)
1 626  /m²(123 m²)
Sale
Houses
House
7 rooms
123 m2
Commercial property
21 m2
Land
322 m2
-Sols
Land
85 m2
-Jardins
/Jardin potager
2025-01-31
310 000 
5 345  /m²(58 m²)
Sale
Apartments
Apartment
4 rooms
58 m2
1 outbuilding
2025-01-31
205 000 
2 887  /m²(71 m²)
Sale
Apartments
Apartment
2 rooms
35 m2
Apartments
Apartment
3 rooms
36 m2
1 outbuilding
2025-01-30
55 000 
Sale
Land
200 m2
-Terrains à bâtir
2025-01-15
320 000 
3 368  /m²(95 m²)
Sale
Houses
House
3 rooms
95 m2
Land
837 m2
-Sols
2024-12-30
320 000 
3 556  /m²(90 m²)
Sale
Apartments
Apartment
4 rooms
90 m2
4 outbuildings
339 transactions listed in the municipality

Pyrénées-Orientales (66)

Most expensive cities

City
name
Descending orderHouses
house
Price per m²
4 917 
4 606 
4 559 
4 360 
4 173 
3 866 
3 782 
City
name
Descending orderApartments
apt.
Price per m²
5 288 
3 778 
3 636 
3 518 
3 476 
3 467 
3 448 
3 438 

Least expensive cities

City
name
Ascending orderHouses
house
Price per m²
566 
570 
574 
615 
643 
732 
818 
822 
City
name
Ascending orderApartments
apt.
Price per m²
196 
231 
330 
355 
375 
403 
421 
465