emooki
HomePrice mapTransactions
🇬🇧 English🇫🇷 Français🇩🇪 Deutsch🇪🇸 Español🇮🇹 Italiano

Real estate price map


Real estate price map in the municipality of Baho, choose a section to see transactions by parcel.

Pyrénées-Orientales (66)

Baho - Real estate price m²

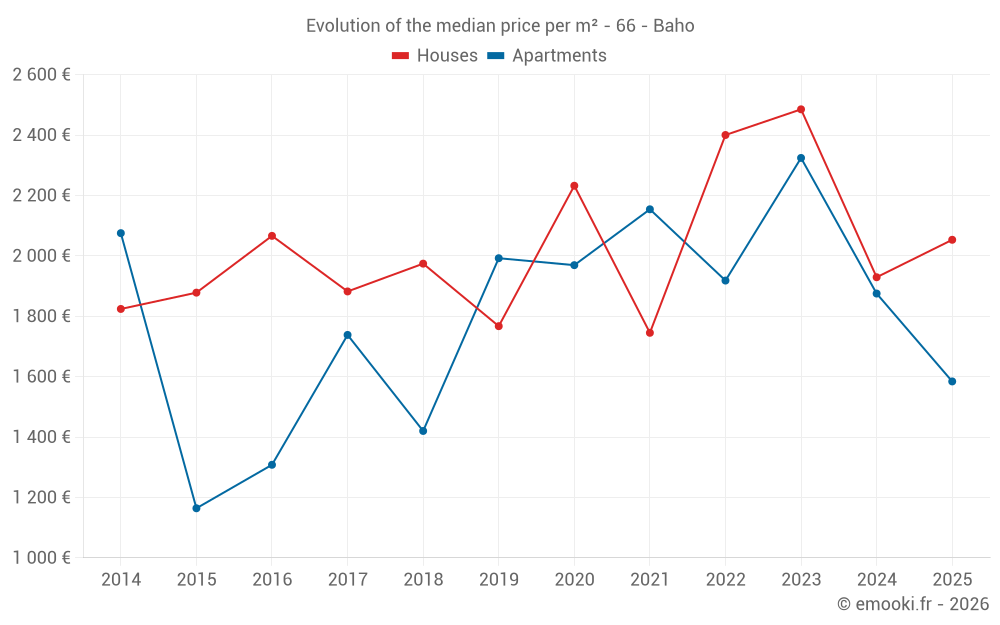
Median price of real estate
in the municipality of Baho

HousesHouses
2 053  /m²
1-23-45-67-89-10
Reliability 8/10
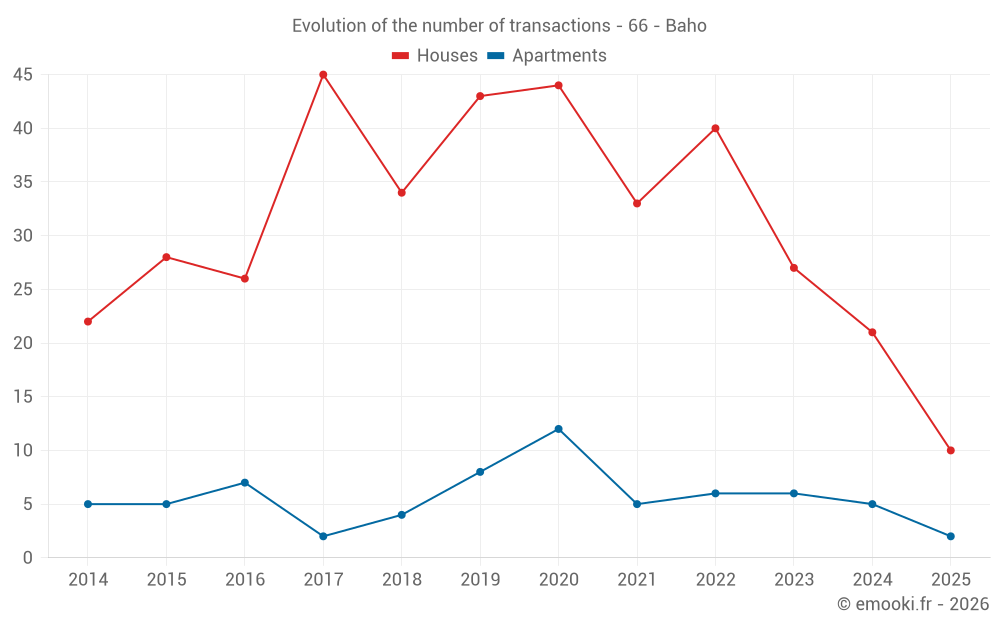
Median price on the 22 transactions of the last 12 months.
from 1 552 to
2 990  /m²
60% of transactions from the 2nd to the 8th deciles.
ApartmentsApartments
1 995  /m²
1-23-45-67-89-10
Reliability 6/10
Median price on the 17 transactions of the last 36 months.
from 1 373 to
2 837  /m²
60% of transactions from the 2nd to the 8th deciles.
DwellingsDwellings
2 001  /m²
1-23-45-67-89-10
Reliability 8/10
Median price on the 27 transactions of the last 12 months.
from 1 477 to
2 865  /m²
60% of transactions from the 2nd to the 8th deciles.
HousesEvolution of the price per m² of houses since...
1 year
+6.4%
2 years
-17%
3 years
-14%
4 years
+18%
5 years
-8%
6 years
+16%
7 years
+4%
8 years
+9.1%
9 years
-0.6%
10 years
+9.3%
11 years
+13%
The price per m² of houses has decreased by 17% since 2 years, but it has increased by 18% in 4 years.

Yearly evolution

Evolution of the median price per m²

Evolution of the median price per m² - 66 - Baho

Evolution of the number of transactions

Warning, last year incomplete. Projections made based on the proportions between semesters of the previous year at the departmental/national level and by type of property.

Evolution of the number of transactions - 66 - Baho

Yearly data

Descending order
Year
Houses
house
transactions
Houses
house
Price per m²
Apartments
apt.
transactions
Apartments
apt.
Price per m²
2025
10
2 053 
2
1 584 
2024
21
1 929 
5
1 875 
2023
27
2 485 
6
2 324 
2022
40
2 400 
6
1 918 
2021
33
1 745 
5
2 154 
2020
44
2 232 
12
1 969 
2019
43
1 767 
8
1 992 
2018
34
1 974 
4
1 420 
2017
45
1 882 
2
1 738 
2016
26
2 066 
7
1 308 
2015
28
1 878 
5
1 164 
2014
22
1 824 
5
2 075 

Analysis

Structure of prices per m²

Values of price percentiles per m² over the periods used for the estimated price of each type of property.

Structure of transaction amounts

Values of transaction amounts percentiles over the periods used for the estimated price of each type of property.

Transaction amounts and prices per m² by percentile

Ascending order
Percentile
Houses
house
Price per m²
Houses
house
Transaction amount
Apartments
apt.
Price per m²
Apartments
apt.
Transaction amount
10th percentile
1 351 
74 100 
1 084 
91 506 
20th percentile
1 552 
107 K
1 373 
98 280 
30th percentile
1 732 
150 K
1 656 
104 K
40th percentile
1 914 
175 K
1 807 
111 K
50th percentile
2 053 
198 K
1 995 
113 K
60th percentile
2 118 
229 K
2 279 
116 K
70th percentile
2 467 
239 K
2 636 
125 K
80th percentile
2 990 
260 K
2 837 
168 K
90th percentile
3 204 
375 K
2 926 
183 K

National and departmental comparison

Evolution of the median price per m² of houses

Evolution of the median price per m² of apartments

Quarterly evolution

Evolution of the median price per m²

Evolution of the number of transactions

Quarterly data

Descending order
Quarter
Houses
house
transactions
Houses
house
Price per m²
Apartments
apt.
transactions
Apartments
apt.
Price per m²
2025 Q1
10
2 053 
2
1 584 
2024 Q4
7
3 092 
2
1 559 
2024 Q3
5
1 464 
1
2 897 
2024 Q2
4
1 910 
1
2 846 
2024 Q1
5
1 800 
1
1 875 
2023 Q4
8
2 442 
0
--- 
2023 Q3
8
2 530 
2
2 016 
2023 Q2
8
2 296 
1
1 995 
2023 Q1
3
2 536 
3
2 800 
2022 Q4
11
2 875 
1
1 250 
2022 Q3
17
2 294 
3
1 710 
2022 Q2
6
1 988 
2
2 231 
2022 Q1
6
1 570 
0
--- 
2021 Q4
7
1 712 
1
2 833 
2021 Q3
14
1 774 
1
2 069 
2021 Q2
6
1 685 
2
2 227 
2021 Q1
6
1 810 
1
1 176 
2020 Q4
15
2 233 
5
1 938 
2020 Q3
11
1 965 
3
2 117 
2020 Q2
11
2 500 
3
1 933 
2020 Q1
7
2 231 
1
2 000 
2019 Q4
12
1 966 
3
2 119 
2019 Q3
11
2 044 
1
1 127 
2019 Q2
9
1 767 
3
1 731 
2019 Q1
11
1 535 
1
2 250 
2018 Q4
6
2 290 
1
1 950 
2018 Q3
11
1 947 
0
--- 
2018 Q2
7
1 733 
0
--- 
2018 Q1
10
1 964 
3
1 364 
2017 Q4
11
1 500 
1
1 860 
2017 Q3
12
2 080 
0
--- 
2017 Q2
12
1 918 
0
--- 
2017 Q1
10
1 992 
1
1 615 
2016 Q4
4
2 194 
5
1 286 
2016 Q3
6
2 124 
1
1 724 
2016 Q2
11
2 095 
1
1 591 
2016 Q1
5
1 864 
0
--- 
2015 Q4
5
1 277 
1
686 
2015 Q3
6
1 788 
3
1 259 
2015 Q2
8
1 878 
1
1 019 
2015 Q1
9
2 097 
0
--- 
2014 Q4
11
1 563 
2
1 710 
2014 Q3
6
2 136 
2
2 293 
2014 Q2
2
3 012 
1
2 000 
2014 Q1
3
1 100 
0
--- 

Overview of the latest real estate transactions

The following list is an anonymized overview of the latest transactions. For more details and to find all transactions, please use the map to view transactions by plot or the transaction search page for a search by criteria.

2025-06-19
3 500 
Sale
Land
6279 m2
-Vignes
2025-06-12
108 000 
617  /m²(175 m²)
Sale
Houses
House
5 rooms
131 m2
Land
59 m2
-Sols
Apartments
Apartment
2 rooms
44 m2
2025-05-13
6 000 
Sale
Land
2429 m2
-Taillis simples
2025-05-05
142 000 
Sale
Land
393 m2
-Terrains à bâtir
Land
90 m2
-Terrains à bâtir
2025-03-31
245 000 
1 531  /m²(160 m²)
Sale
Commercial property
160 m2
2025-03-28
74 000 
2 114  /m²(35 m²)
Sale
Land
34 m2
-Sols
Houses
House
2 rooms
35 m2
1 outbuilding
Land
74 m2
-Sols
2025-03-24
340 
Sale
Land
248 m2
-Terres
Land
175 m2
-Terres
2025-03-24
150 
Sale
Land
183 m2
-Terres
2025-03-17
418 300 
2 001  /m²(209 m²)
Sale
Houses
House
6 rooms
209 m2
1 outbuilding
Land
4073 m2
-Terrains d'agrément
Land
1000 m2
-Sols
Land
730 m2
-Landes
2025-03-14
196 950 
1 527  /m²(129 m²)
Sale
Houses
House
3 rooms
129 m2
Land
70 m2
-Sols
Land
63 m2
-Sols
2025-03-05
75 000 
1 875  /m²(40 m²)
Sale
Houses
House
1 room
40 m2
Land
35 m2
-Sols
2025-03-03
237 500 
2 121  /m²(112 m²)
Sale
Houses
House
5 rooms
112 m2
1 outbuilding
Land
199 m2
-Sols
2025-02-28
256 500 
3 054  /m²(84 m²)
Sale
Houses
House
4 rooms
84 m2
Land
404 m2
-Sols
2025-02-21
97 200 
2 430  /m²(40 m²)
Sale
Apartments
Apartment
2 rooms
40 m2
1 outbuilding
2025-01-31
148 000 
Sale
Land
292 m2
-Terrains à bâtir
Land
98 m2
-Terrains à bâtir
2025-01-31
6 500 
Sale
Land
729 m2
-Vignes
Land
269 m2
-Vignes
Land
1139 m2
-Vignes
Land
4995 m2
-Vignes
Land
736 m2
-Vignes
2025-01-24
4 000 
Sale
Land
1566 m2
-Terres
2025-01-20
220 000 
1 679  /m²(131 m²)
Sale
Houses
House
4 rooms
131 m2
Land
524 m2
-Sols
2025-01-17
260 567 
2 606  /m²(100 m²)
Sale
Houses
House
5 rooms
100 m2
Land
254 m2
-Sols
2025-01-07
115 000 
737  /m²(156 m²)
Sale
Apartments
Apartment
3 rooms
75 m2
Apartments
Apartment
3 rooms
81 m2
1 outbuilding
Land
360 m2
-Sols
718 transactions listed in the municipality

Pyrénées-Orientales (66)

Most expensive cities

City
name
Descending orderHouses
house
Price per m²
4 917 
4 606 
4 559 
4 360 
4 173 
3 866 
3 782 
City
name
Descending orderApartments
apt.
Price per m²
5 288 
3 778 
3 636 
3 518 
3 476 
3 467 
3 448 
3 438 

Least expensive cities

City
name
Ascending orderHouses
house
Price per m²
566 
570 
574 
615 
643 
732 
818 
822 
City
name
Ascending orderApartments
apt.
Price per m²
196 
231 
330 
355 
375 
403 
421 
465