emooki
HomePrice mapTransactions
🇬🇧 English🇫🇷 Français🇩🇪 Deutsch🇪🇸 Español🇮🇹 Italiano

Real estate price map


Real estate price map in the municipality of Montreuil-sur-Mer, choose a section to see transactions by parcel.

Pas-de-Calais (62)

Montreuil-sur-Mer - Real estate price m²

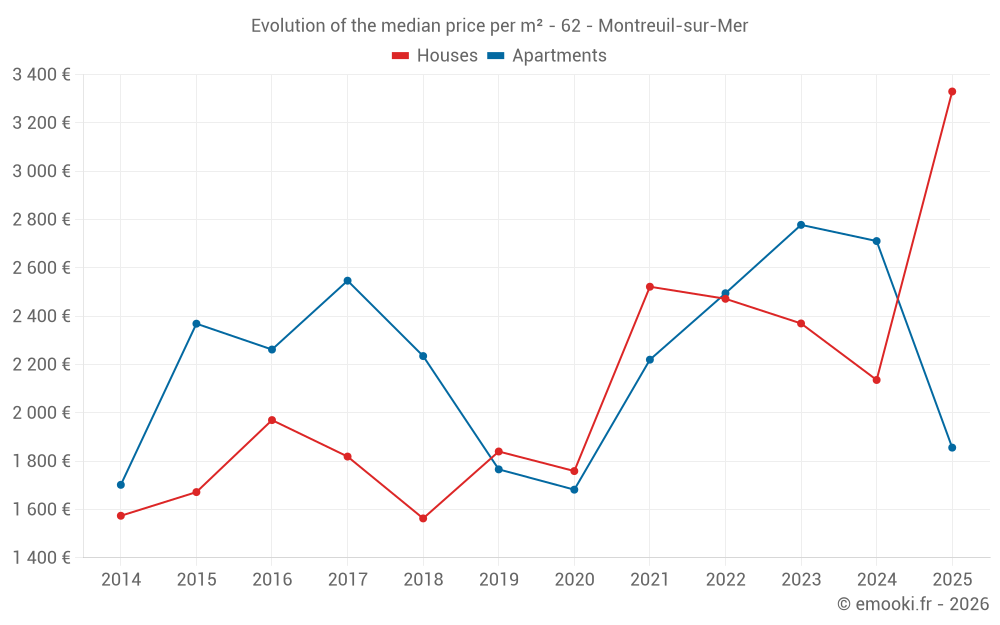
Median price of real estate
in the municipality of Montreuil-sur-Mer

HousesHouses
2 288  /m²
1-23-45-67-89-10
Reliability 7/10
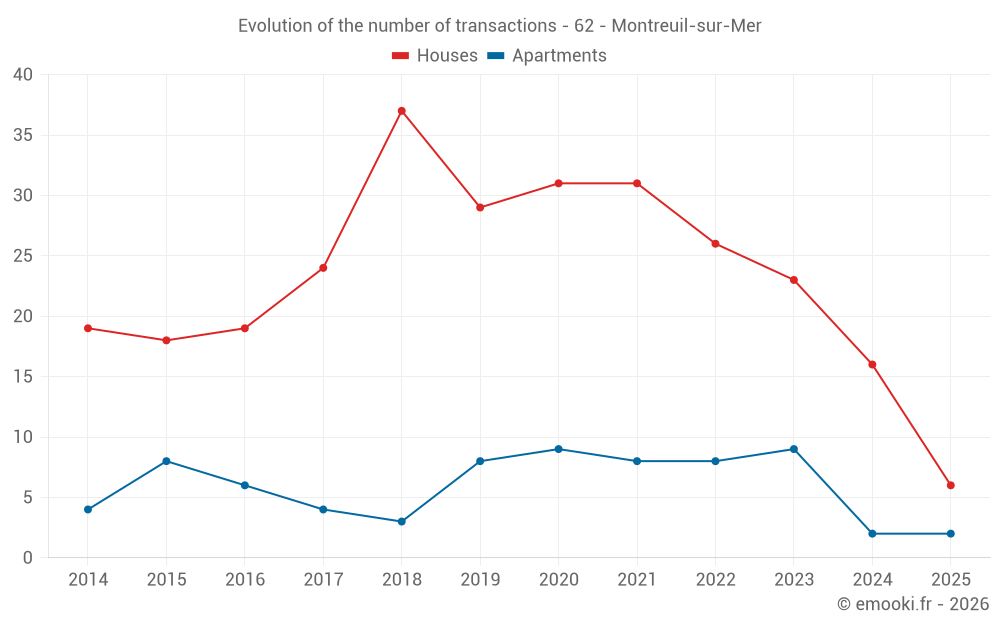
Median price on the 34 transactions of the last 24 months.
from 1 763 to
3 028  /m²
60% of transactions from the 2nd to the 8th deciles.
ApartmentsApartments
2 667  /m²
1-23-45-67-89-10
Reliability 6/10
Median price on the 17 transactions of the last 36 months.
from 1 563 to
2 868  /m²
60% of transactions from the 2nd to the 8th deciles.
DwellingsDwellings
2 400  /m²
1-23-45-67-89-10
Reliability 8/10
Median price on the 17 transactions of the last 12 months.
from 1 836 to
3 885  /m²
60% of transactions from the 2nd to the 8th deciles.
HousesEvolution of the price per m² of houses since...
1 year
+56%
2 years
+41%
3 years
+35%
4 years
+32%
5 years
+89%
6 years
+81%
7 years
+113%
8 years
+83%
9 years
+69%
10 years
+99%
11 years
+112%

Yearly evolution

Evolution of the median price per m²

Evolution of the median price per m² - 62 - Montreuil-sur-Mer

Evolution of the number of transactions

Warning, last year incomplete. Projections made based on the proportions between semesters of the previous year at the departmental/national level and by type of property.

Evolution of the number of transactions - 62 - Montreuil-sur-Mer

Yearly data

Descending order
Year
Houses
house
transactions
Houses
house
Price per m²
Apartments
apt.
transactions
Apartments
apt.
Price per m²
2025
6
3 330 
2
1 856 
2024
16
2 136 
2
2 711 
2023
23
2 370 
9
2 778 
2022
26
2 472 
8
2 495 
2021
31
2 522 
8
2 220 
2020
31
1 759 
9
1 682 
2019
29
1 840 
8
1 766 
2018
37
1 563 
3
2 235 
2017
24
1 819 
4
2 547 
2016
19
1 970 
6
2 262 
2015
18
1 672 
8
2 369 
2014
19
1 574 
4
1 702 

Analysis

Structure of prices per m²

Values of price percentiles per m² over the periods used for the estimated price of each type of property.

Structure of transaction amounts

Values of transaction amounts percentiles over the periods used for the estimated price of each type of property.

Transaction amounts and prices per m² by percentile

Ascending order
Percentile
Houses
house
Price per m²
Houses
house
Transaction amount
Apartments
apt.
Price per m²
Apartments
apt.
Transaction amount
10th percentile
1 484 
90 850 
1 329 
116 K
20th percentile
1 763 
136 K
1 563 
126 K
30th percentile
2 091 
152 K
1 903 
130 K
40th percentile
2 133 
173 K
2 496 
132 K
50th percentile
2 288 
195 K
2 667 
148 K
60th percentile
2 394 
200 K
2 749 
155 K
70th percentile
2 533 
236 K
2 778 
165 K
80th percentile
3 028 
301 K
2 868 
213 K
90th percentile
3 947 
384 K
3 078 
251 K

National and departmental comparison

Evolution of the median price per m² of houses

Evolution of the median price per m² of apartments

Quarterly evolution

Evolution of the median price per m²

Evolution of the number of transactions

Quarterly data

Descending order
Quarter
Houses
house
transactions
Houses
house
Price per m²
Apartments
apt.
transactions
Apartments
apt.
Price per m²
2025 Q1
6
3 330 
2
1 856 
2024 Q4
5
2 197 
0
--- 
2024 Q3
4
3 354 
0
--- 
2024 Q2
4
1 696 
1
2 755 
2024 Q1
3
2 833 
1
2 667 
2023 Q4
4
2 224 
2
2 368 
2023 Q3
8
2 212 
2
3 014 
2023 Q2
6
2 710 
4
2 035 
2023 Q1
5
2 880 
1
3 964 
2022 Q4
10
3 183 
0
--- 
2022 Q3
9
2 371 
4
2 094 
2022 Q2
3
1 697 
0
--- 
2022 Q1
4
2 301 
4
2 495 
2021 Q4
7
2 600 
1
2 188 
2021 Q3
5
2 593 
3
2 810 
2021 Q2
11
2 092 
3
2 253 
2021 Q1
8
2 447 
1
2 053 
2020 Q4
8
1 992 
2
1 882 
2020 Q3
7
2 194 
4
936 
2020 Q2
8
1 456 
2
2 408 
2020 Q1
8
1 173 
1
1 667 
2019 Q4
9
1 880 
2
2 006 
2019 Q3
10
2 150 
2
1 722 
2019 Q2
4
1 810 
2
2 120 
2019 Q1
6
1 576 
2
2 050 
2018 Q4
12
1 438 
0
--- 
2018 Q3
11
1 489 
1
2 235 
2018 Q2
3
1 311 
1
2 225 
2018 Q1
11
1 648 
1
2 344 
2017 Q4
11
1 794 
1
3 000 
2017 Q3
5
1 233 
0
--- 
2017 Q2
4
2 269 
3
2 442 
2017 Q1
4
1 746 
0
--- 
2016 Q4
7
1 970 
0
--- 
2016 Q3
4
2 244 
2
2 557 
2016 Q2
4
1 374 
3
1 915 
2016 Q1
4
1 850 
1
2 609 
2015 Q4
5
1 645 
4
2 719 
2015 Q3
5
2 391 
1
735 
2015 Q2
3
1 420 
1
1 822 
2015 Q1
5
1 678 
2
2 385 
2014 Q4
7
1 640 
1
1 755 
2014 Q3
5
1 649 
3
1 649 
2014 Q2
3
1 694 
0
--- 
2014 Q1
4
1 340 
0
--- 

Overview of the latest real estate transactions

The following list is an anonymized overview of the latest transactions. For more details and to find all transactions, please use the map to view transactions by plot or the transaction search page for a search by criteria.

2025-05-30
355 000 
3 901  /m²(91 m²)
Sale
Commercial property
91 m2
Land
82 m2
-Sols
2025-04-29
240 000 
1 472  /m²(163 m²)
4 800  /m²(50 m²)
Sale
Houses
House
2 rooms
50 m2
Commercial property
113 m2
Land
98 m2
-Sols
2025-03-29
547 000 
3 747  /m²(146 m²)
Sale
Houses
House
4 rooms
146 m2
Land
152 m2
-Sols
2025-03-19
302 000 
2 127  /m²(142 m²)
Sale
Houses
House
8 rooms
142 m2
1 outbuilding
Land
102 m2
-Sols
2025-03-17
90 000 
2 813  /m²(32 m²)
Sale
Commercial property
32 m2
2025-03-05
300 000 
4 286  /m²(70 m²)
Sale
Houses
House
4 rooms
70 m2
1 outbuilding
Land
215 m2
-Sols
Land
245 m2
-Jardins
2025-02-28
500 000 
1 543  /m²(324 m²)
3 731  /m²(134 m²)
Sale
Apartments
Apartment
3 rooms
66 m2
Apartments
Apartment
3 rooms
68 m2
Commercial property
190 m2
Land
370 m2
-Sols
2025-02-26
236 000 
2 914  /m²(81 m²)
Sale
Houses
House
4 rooms
81 m2
Land
173 m2
-Sols
Land
465 m2
-Jardins
2025-02-21
23 000 
Sale
Land
865 m2
-Jardins
Land
1120 m2
-Jardins
2025-01-29
234 000 
971  /m²(241 m²)
Sale
Apartments
Apartment
4 rooms
67 m2
Apartments
Apartment
3 rooms
65 m2
Apartments
Apartment
2 rooms
58 m2
Apartments
Apartment
2 rooms
51 m2
Land
396 m2
-Sols
2025-01-22
120 000 
2 400  /m²(50 m²)
Sale
Houses
House
3 rooms
50 m2
Land
47 m2
-Sols
2025-01-10
148 000 
2 741  /m²(54 m²)
Sale
Apartments
Apartment
2 rooms
54 m2
2025-01-06
196 000 
3 920  /m²(50 m²)
Sale
Houses
House
3 rooms
50 m2
Land
28 m2
-Sols
2024-12-31
193 300 
2 197  /m²(88 m²)
Sale
Houses
House
3 rooms
88 m2
Land
114 m2
-Sols
Land
15 m2
-Sols
2024-12-31
150 000 
Sale
Land
19 m2
-Sols
Land
103 m2
-Jardins
2024-12-31
186 375 
1 742  /m²(107 m²)
Sale
Houses
House
6 rooms
107 m2
Land
70 m2
-Sols
2024-12-23
135 000 
515  /m²(262 m²)
582  /m²(232 m²)
Sale
Apartments
Apartment
2 rooms
45 m2
Apartments
Apartment
2 rooms
30 m2
Apartments
Apartment
2 rooms
34 m2
Apartments
Apartment
4 rooms
123 m2
Commercial property
30 m2
2 outbuildings
Land
161 m2
-Sols
Land
287 m2
-Jardins
2024-11-23
160 000 
2 286  /m²(70 m²)
Sale
Houses
House
4 rooms
70 m2
Land
49 m2
-Sols
2024-11-07
140 000 
1 918  /m²(73 m²)
Sale
Commercial property
73 m2
Land
91 m2
-Sols
2024-10-31
149 300 
1 777  /m²(84 m²)
Sale
Houses
House
4 rooms
84 m2
Land
298 m2
-Sols
552 transactions listed in the municipality

Pas-de-Calais (62)

Most expensive cities

City
name
Descending orderHouses
house
Price per m²
4 400 
4 043 
3 768 
3 642 
3 621 
3 567 
3 314 
3 152 
City
name
Descending orderApartments
apt.
Price per m²
6 095 
4 842 
4 533 
4 432 
4 336 
4 289 
3 892 
3 424 

Least expensive cities

City
name
Ascending orderHouses
house
Price per m²
515 
580 
641 
706 
718 
722 
725 
City
name
Ascending orderApartments
apt.
Price per m²
199 
240 
424 
479