emooki
HomePrice mapTransactions
🇬🇧 English🇫🇷 Français🇩🇪 Deutsch🇪🇸 Español🇮🇹 Italiano

Real estate price map


Real estate price map in the municipality of Carvin.

Pas-de-Calais (62)
Carvin

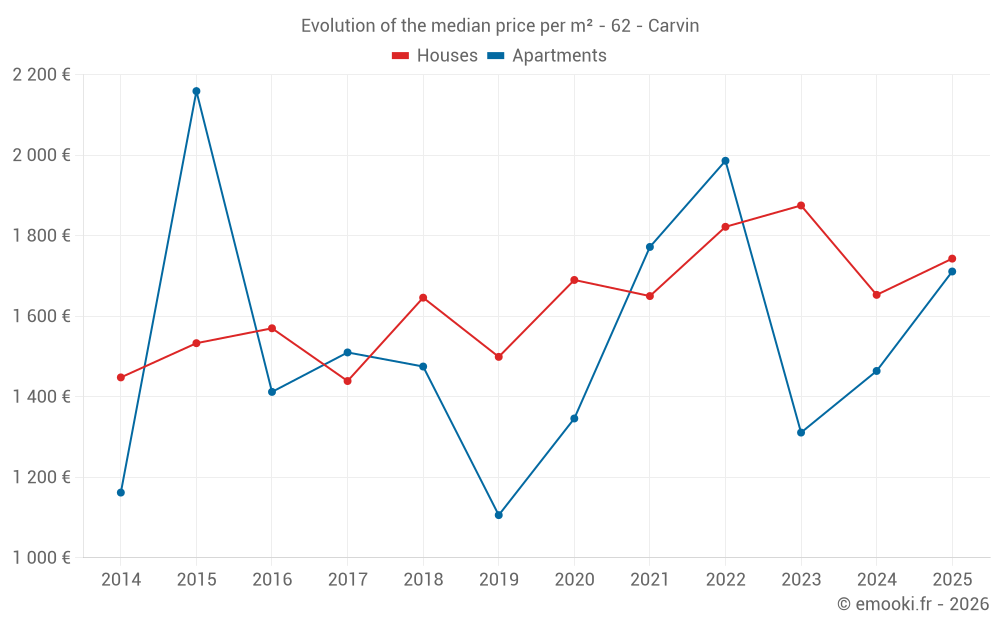
Median price of real estate
in the municipality of Carvin

HousesHouses
1 699 € /m²
1-23-45-67-89-10
Reliability 10/10
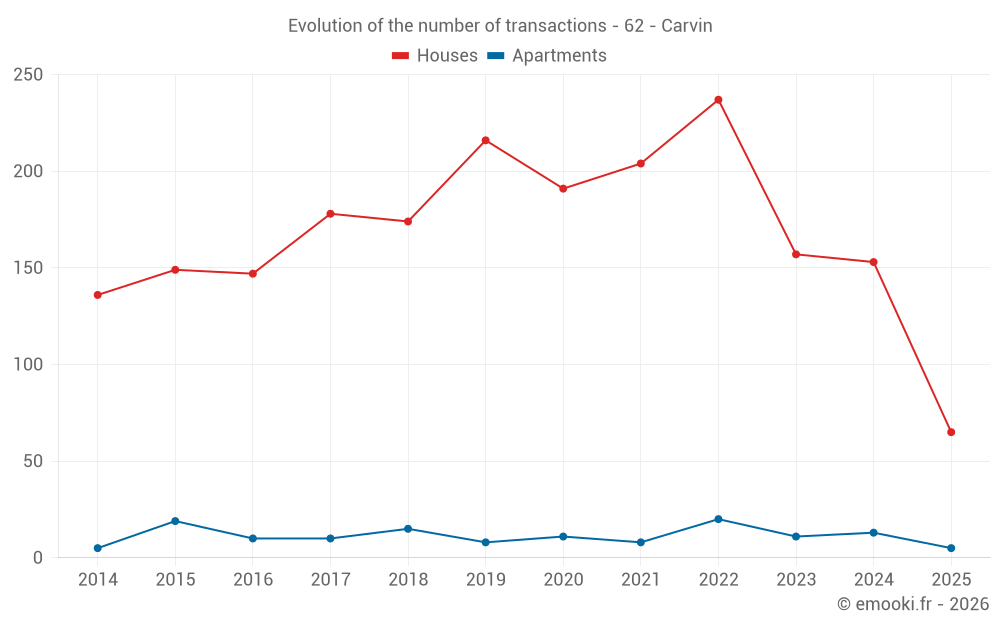
Median price on the 25 transactions of the last 3 months.
from 1 103 to
2 117 € /m²
60% of transactions from the 2nd to the 8th deciles.
ApartmentsApartments
1 647 € /m²
1-23-45-67-89-10
Reliability 7/10
Median price on the 23 transactions of the last 24 months.
from 1 058 to
2 144 € /m²
60% of transactions from the 2nd to the 8th deciles.
DwellingsDwellings
1 696 € /m²
1-23-45-67-89-10
Reliability 10/10
Median price on the 28 transactions of the last 3 months.
from 1 078 to
2 092 € /m²
60% of transactions from the 2nd to the 8th deciles.
HousesEvolution of the price per m² of houses since...
1 year
+5.4%
2 years
-7%
3 years
-4.3%
4 years
+5.6%
5 years
+3.1%
6 years
+16%
7 years
+5.9%
8 years
+21%
9 years
+11%
10 years
+14%
11 years
+20%
ApartmentsEvolution of the price per m² of apartments since...
1 year
+17%
2 years
+31%
3 years
-14%
4 years
-3.4%
5 years
+27%
6 years
+55%
7 years
+16%
8 years
+13%
9 years
+21%
10 years
-21%
11 years
+47%

Yearly evolution

Evolution of the median price per m²

Evolution of the number of transactions

Warning, last year incomplete. Projections made based on the proportions between semesters of the previous year at the departmental/national level and by type of property.

Yearly data

Descending order
Year
Houses
house
transactions
Houses
house
Price per m²
Apartments
apt.
transactions
Apartments
apt.
Price per m²
2025
65
1 743 €
5
1 711 €
2024
153
1 653 €
13
1 464 €
2023
157
1 875 €
11
1 311 €
2022
237
1 822 €
20
1 986 €
2021
204
1 650 €
8
1 772 €
2020
191
1 690 €
11
1 346 €
2019
216
1 499 €
8
1 106 €
2018
174
1 646 €
15
1 475 €
2017
178
1 439 €
10
1 510 €
2016
147
1 570 €
10
1 412 €
2015
149
1 533 €
19
2 159 €
2014
136
1 448 €
5
1 162 €

Analysis

Structure of prices per m²

Values of price percentiles per m² over the periods used for the estimated price of each type of property.

Structure of transaction amounts

Values of transaction amounts percentiles over the periods used for the estimated price of each type of property.

Transaction amounts and prices per m² by percentile

Ascending order
Percentile
Houses
house
Price per m²
Houses
house
Transaction amount
Apartments
apt.
Price per m²
Apartments
apt.
Transaction amount
10th percentile
1 028 €
75 900 €
979 €
77 200 €
20th percentile
1 103 €
102 K€
1 058 €
81 500 €
30th percentile
1 223 €
120 K€
1 317 €
108 K€
40th percentile
1 487 €
128 K€
1 454 €
117 K€
50th percentile
1 699 €
151 K€
1 647 €
120 K€
60th percentile
1 874 €
170 K€
1 831 €
125 K€
70th percentile
1 996 €
188 K€
1 919 €
134 K€
80th percentile
2 117 €
202 K€
2 144 €
136 K€
90th percentile
2 270 €
217 K€
2 377 €
189 K€

National and departmental comparison

Evolution of the median price per m² of houses

Evolution of the median price per m² of apartments

Quarterly evolution

Evolution of the median price per m²

Evolution of the number of transactions

Quarterly data

Descending order
Quarter
Houses
house
transactions
Houses
house
Price per m²
Apartments
apt.
transactions
Apartments
apt.
Price per m²
2025 Q2
25
1 699 €
3
1 038 €
2025 Q1
40
1 818 €
2
2 046 €
2024 Q4
44
1 568 €
5
2 360 €
2024 Q3
42
1 956 €
2
1 294 €
2024 Q2
37
1 437 €
1
1 412 €
2024 Q1
30
1 750 €
5
1 321 €
2023 Q4
41
1 443 €
1
1 913 €
2023 Q3
35
1 932 €
4
1 734 €
2023 Q2
40
1 562 €
4
1 285 €
2023 Q1
41
1 916 €
2
1 138 €
2022 Q4
59
1 731 €
2
1 842 €
2022 Q3
80
2 078 €
5
2 293 €
2022 Q2
55
1 829 €
6
2 186 €
2022 Q1
43
1 798 €
7
1 583 €
2021 Q4
52
1 708 €
3
1 787 €
2021 Q3
47
1 567 €
3
1 124 €
2021 Q2
57
1 698 €
2
1 754 €
2021 Q1
48
1 603 €
0
--- €
2020 Q4
59
1 667 €
4
1 496 €
2020 Q3
48
1 686 €
3
1 345 €
2020 Q2
38
1 706 €
1
1 317 €
2020 Q1
46
1 745 €
3
1 077 €
2019 Q4
44
1 346 €
0
--- €
2019 Q3
61
1 741 €
2
1 250 €
2019 Q2
58
1 432 €
3
1 127 €
2019 Q1
53
1 493 €
3
1 074 €
2018 Q4
49
1 627 €
3
1 181 €
2018 Q3
54
1 640 €
5
1 095 €
2018 Q2
32
1 608 €
4
1 566 €
2018 Q1
39
1 829 €
3
1 759 €
2017 Q4
40
1 532 €
2
1 601 €
2017 Q3
32
1 434 €
2
2 046 €
2017 Q2
59
1 600 €
3
1 066 €
2017 Q1
47
1 300 €
3
1 512 €
2016 Q4
39
1 452 €
4
1 499 €
2016 Q3
44
1 569 €
1
1 383 €
2016 Q2
27
1 489 €
3
1 444 €
2016 Q1
37
1 667 €
2
836 €
2015 Q4
40
1 434 €
12
2 208 €
2015 Q3
41
1 533 €
2
924 €
2015 Q2
43
1 436 €
4
1 614 €
2015 Q1
25
1 689 €
1
1 188 €
2014 Q4
34
1 346 €
2
1 112 €
2014 Q3
48
1 426 €
0
--- €
2014 Q2
28
1 312 €
1
905 €
2014 Q1
26
1 630 €
2
1 695 €

Pas-de-Calais (62)

Most expensive cities

City
name
Descending orderHouses
house
Price per m²
9 906 €
4 400 €
4 179 €
4 043 €
3 768 €
3 642 €
3 621 €
3 567 €
3 314 €
3 152 €
City
name
Descending orderApartments
apt.
Price per m²
9 176 €
6 095 €
5 958 €
4 842 €
4 533 €
4 432 €
4 336 €
4 289 €
3 892 €
3 424 €

Least expensive cities

City
name
Ascending orderHouses
house
Price per m²
515 €
553 €
580 €
641 €
657 €
706 €
718 €
722 €
725 €
City
name
Ascending orderApartments
apt.
Price per m²
199 €
240 €
336 €
402 €
424 €
427 €
448 €
477 €
479 €