emooki
HomePrice mapTransactions
🇬🇧 English🇫🇷 Français🇩🇪 Deutsch🇪🇸 Español🇮🇹 Italiano

Real estate price map


Real estate price map in the municipality of Plouay, choose a section to see transactions by parcel.

Morbihan (56)

Plouay - Real estate price m²

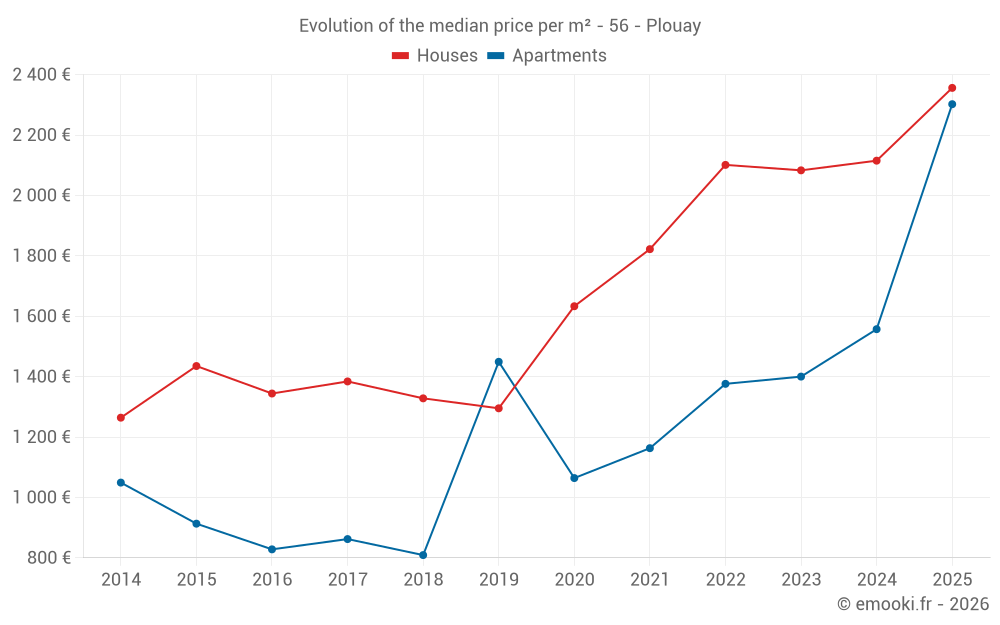
Median price of real estate
in the municipality of Plouay

HousesHouses
2 356  /m²
1-23-45-67-89-10
Reliability 9/10
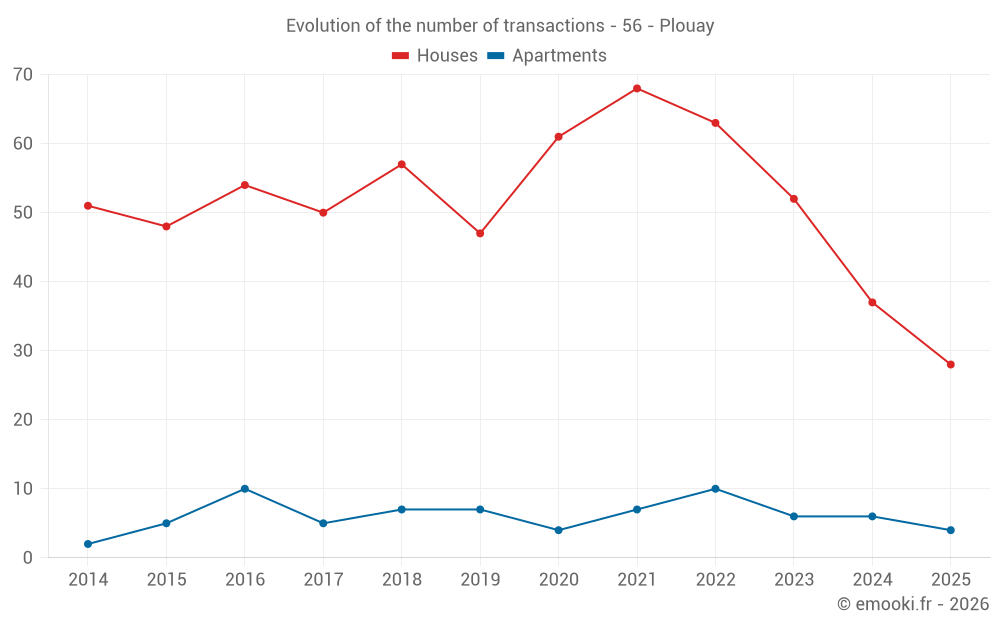
Median price on the 28 transactions of the last 6 months.
from 1 905 to
2 842  /m²
60% of transactions from the 2nd to the 8th deciles.
ApartmentsApartments
1 598  /m²
1-23-45-67-89-10
Reliability 6/10
Median price on the 22 transactions of the last 36 months.
from 1 318 to
1 784  /m²
60% of transactions from the 2nd to the 8th deciles.
DwellingsDwellings
2 356  /m²
1-23-45-67-89-10
Reliability 9/10
Median price on the 32 transactions of the last 6 months.
from 1 871 to
2 902  /m²
60% of transactions from the 2nd to the 8th deciles.
HousesEvolution of the price per m² of houses since...
1 year
+11%
2 years
+13%
3 years
+12%
4 years
+29%
5 years
+44%
6 years
+82%
7 years
+77%
8 years
+70%
9 years
+75%
10 years
+64%
11 years
+86%
ApartmentsEvolution of the price per m² of apartments since...
1 year
+48%
2 years
+64%
3 years
+67%
4 years
+98%
5 years
+116%
6 years
+59%
7 years
+185%
8 years
+167%
9 years
+178%
10 years
+152%
11 years
--

Yearly evolution

Evolution of the median price per m²

Evolution of the median price per m² - 56 - Plouay

Evolution of the number of transactions

Warning, last year incomplete. Projections made based on the proportions between semesters of the previous year at the departmental/national level and by type of property.

Evolution of the number of transactions - 56 - Plouay

Yearly data

Descending order
Year
Houses
house
transactions
Houses
house
Price per m²
Apartments
apt.
transactions
Apartments
apt.
Price per m²
2025
28
2 356 
4
2 302 
2024
37
2 115 
6
1 557 
2023
52
2 083 
6
1 400 
2022
63
2 101 
10
1 376 
2021
68
1 822 
7
1 163 
2020
61
1 633 
4
1 064 
2019
47
1 295 
7
1 449 
2018
57
1 328 
7
809 
2017
50
1 384 
5
862 
2016
54
1 344 
10
828 
2015
48
1 435 
5
913 
2014
51
1 264 
2
1 049 

Analysis

Structure of prices per m²

Values of price percentiles per m² over the periods used for the estimated price of each type of property.

Structure of transaction amounts

Values of transaction amounts percentiles over the periods used for the estimated price of each type of property.

Transaction amounts and prices per m² by percentile

Ascending order
Percentile
Houses
house
Price per m²
Houses
house
Transaction amount
Apartments
apt.
Price per m²
Apartments
apt.
Transaction amount
10th percentile
1 540 
141 K
1 104 
87 350 
20th percentile
1 905 
180 K
1 318 
106 K
30th percentile
2 123 
201 K
1 443 
119 K
40th percentile
2 271 
219 K
1 490 
138 K
50th percentile
2 356 
225 K
1 598 
153 K
60th percentile
2 459 
241 K
1 670 
166 K
70th percentile
2 654 
250 K
1 735 
192 K
80th percentile
2 842 
281 K
1 784 
255 K
90th percentile
3 012 
363 K
2 005 
299 K

National and departmental comparison

Evolution of the median price per m² of houses

Evolution of the median price per m² of apartments

Quarterly evolution

Evolution of the median price per m²

Evolution of the number of transactions

Quarterly data

Descending order
Quarter
Houses
house
transactions
Houses
house
Price per m²
Apartments
apt.
transactions
Apartments
apt.
Price per m²
2025 Q2
11
2 923 
1
1 786 
2025 Q1
17
2 353 
3
2 817 
2024 Q4
13
2 463 
2
1 764 
2024 Q3
12
1 984 
1
1 484 
2024 Q2
7
2 296 
2
1 404 
2024 Q1
5
1 899 
1
1 614 
2023 Q4
15
2 115 
1
120 
2023 Q3
7
2 083 
1
1 244 
2023 Q2
14
2 100 
1
1 446 
2023 Q1
16
1 994 
3
1 686 
2022 Q4
19
2 174 
4
1 478 
2022 Q3
18
2 038 
2
1 592 
2022 Q2
16
1 868 
1
1 257 
2022 Q1
10
2 421 
3
1 277 
2021 Q4
17
1 875 
3
926 
2021 Q3
26
2 029 
4
1 202 
2021 Q2
9
1 977 
0
--- 
2021 Q1
16
1 654 
0
--- 
2020 Q4
16
1 718 
0
--- 
2020 Q3
21
1 625 
1
1 840 
2020 Q2
15
1 577 
2
960 
2020 Q1
9
1 758 
1
967 
2019 Q4
16
1 918 
1
2 000 
2019 Q3
16
1 517 
2
1 120 
2019 Q2
7
1 081 
2
1 468 
2019 Q1
8
1 221 
2
950 
2018 Q4
20
1 254 
2
1 066 
2018 Q3
14
1 314 
0
--- 
2018 Q2
14
1 454 
1
1 437 
2018 Q1
9
1 444 
4
582 
2017 Q4
16
1 192 
1
1 133 
2017 Q3
10
1 394 
1
862 
2017 Q2
11
1 477 
1
826 
2017 Q1
13
1 410 
2
704 
2016 Q4
15
1 351 
2
935 
2016 Q3
12
1 318 
4
775 
2016 Q2
19
1 261 
2
1 122 
2016 Q1
8
1 436 
2
835 
2015 Q4
16
1 526 
0
--- 
2015 Q3
15
1 157 
2
930 
2015 Q2
11
1 387 
1
1 625 
2015 Q1
6
1 422 
2
776 
2014 Q4
18
1 408 
2
1 049 
2014 Q3
8
1 163 
0
--- 
2014 Q2
16
1 111 
0
--- 
2014 Q1
9
1 429 
0
--- 

Overview of the latest real estate transactions

The following list is an anonymized overview of the latest transactions. For more details and to find all transactions, please use the map to view transactions by plot or the transaction search page for a search by criteria.

2025-06-28
456 000 
2 923  /m²(156 m²)
Sale
Houses
House
4 rooms
156 m2
Land
1052 m2
-Sols
2025-06-25
150 000 
1 786  /m²(84 m²)
Sale
Apartments
Apartment
3 rooms
84 m2
2 outbuildings
2025-06-23
225 000 
3 041  /m²(74 m²)
Sale
Houses
House
3 rooms
74 m2
Land
409 m2
-Sols
2025-05-28
4 975 
Sale
Land
787 m2
-Terres
2025-05-26
285 000 
2 280  /m²(125 m²)
Sale
Houses
House
6 rooms
125 m2
Land
2866 m2
-Prés
Land
714 m2
-Sols
2025-05-23
25 000 
676  /m²(37 m²)
Exchange
Houses
House
1 room
37 m2
Land
51 m2
-Sols
2025-05-23
5 000 
Exchange
Land
100 m2
-Sols
2025-05-23
1 100 000 
Sale
Land
891 m2
-Sols
Land
9 m2
-Sols
Land
34 m2
-Sols
2025-05-23
120 000 
3 243  /m²(37 m²)
Sale
Houses
House
1 room
37 m2
Land
51 m2
-Sols
1 outbuilding
Land
565 m2
-Sols
Land
159 m2
-Sols
2025-05-06
86 000 
1 075  /m²(80 m²)
Sale
Houses
House
3 rooms
50 m2
Houses
House
1 room
30 m2
1 outbuilding
Land
435 m2
-Sols
2025-04-30
180 000 
1 452  /m²(124 m²)
Sale
Houses
House
5 rooms
124 m2
1 outbuilding
Land
477 m2
-Sols
2025-04-30
1 
Sale
Land
84 m2
-Terres
2025-04-29
295 000 
1 113  /m²(265 m²)
Sale
Houses
House
6 rooms
145 m2
Land
1000 m2
-Sols
Houses
House
3 rooms
120 m2
1 outbuilding
Land
762 m2
-Terrains d'agrément
Land
1250 m2
-Futaies résineuses
Land
450 m2
-Futaies résineuses
Land
500 m2
-Sols
Land
3583 m2
-Terres
2025-04-28
213 000 
3 000  /m²(71 m²)
Sale
Houses
House
2 rooms
71 m2
Land
4720 m2
-Terres
Land
720 m2
-Sols
2025-04-24
415 000 
3 168  /m²(131 m²)
Sale
Houses
House
4 rooms
131 m2
1 outbuilding
Land
1765 m2
-Terrains d'agrément
Land
1000 m2
-Sols
2025-04-18
191 000 
1 949  /m²(98 m²)
Sale
Houses
House
4 rooms
98 m2
Land
55 m2
-Sols
Land
19 m2
-Sols
Land
2 m2
-Sols
Land
69 m2
-Sols
2025-04-17
275 000 
2 218  /m²(124 m²)
Sale
Houses
House
5 rooms
124 m2
Land
716 m2
-Sols
2025-04-15
1 400 
Sale
Land
28 m2
-Sols
2025-04-15
220 000 
2 933  /m²(75 m²)
Sale
Houses
House
4 rooms
75 m2
Land
500 m2
-Sols
Land
859 m2
-Terrains d'agrément
2025-03-28
3 500 
Sale
Land
4090 m2
-Terres
1204 transactions listed in the municipality

Morbihan (56)

Most expensive cities

City
name
Descending orderHouses
house
Price per m²
6 560 
5 843 
5 741 
5 625 
5 440 
5 366 
5 319 
5 302 
5 112 
City
name
Descending orderApartments
apt.
Price per m²
6 879 
5 986 
5 736 
5 232 
5 000 
4 948 
4 613 

Least expensive cities

City
name
Ascending orderHouses
house
Price per m²
747 
788 
904 
920 
921 
949 
1 020 
City
name
Ascending orderApartments
apt.
Price per m²
167 
325 
368 
388 
417 
430 
432 
458 
475 
482