emooki
HomePrice mapTransactions
🇬🇧 English🇫🇷 Français🇩🇪 Deutsch🇪🇸 Español🇮🇹 Italiano

Real estate price map


Real estate price map in the municipality of Elven, choose a section to see transactions by parcel.

Morbihan (56)

Elven - Real estate price m²

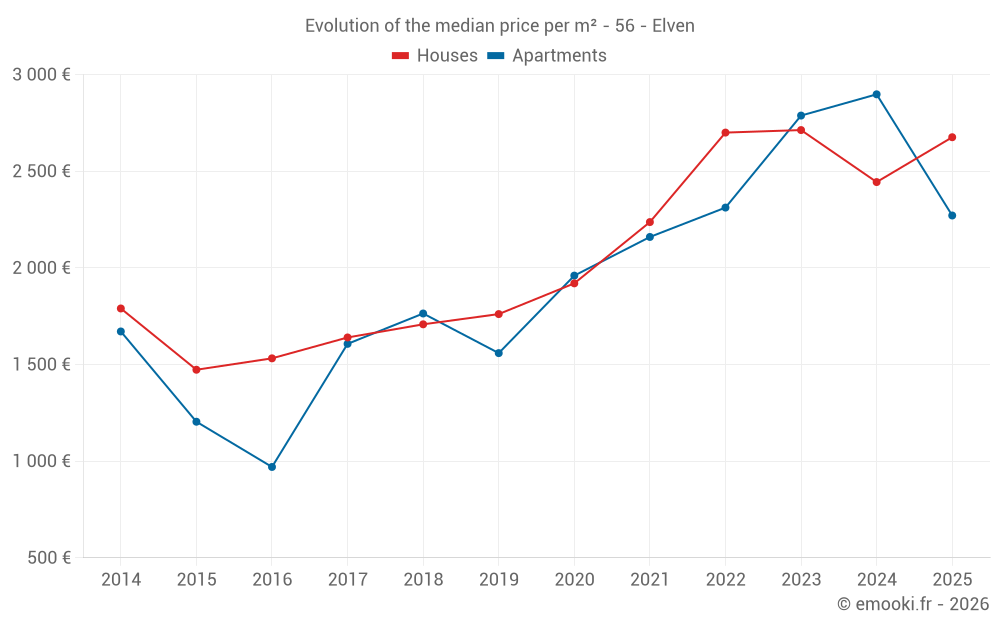
Median price of real estate
in the municipality of Elven

HousesHouses
2 676  /m²
1-23-45-67-89-10
Reliability 9/10
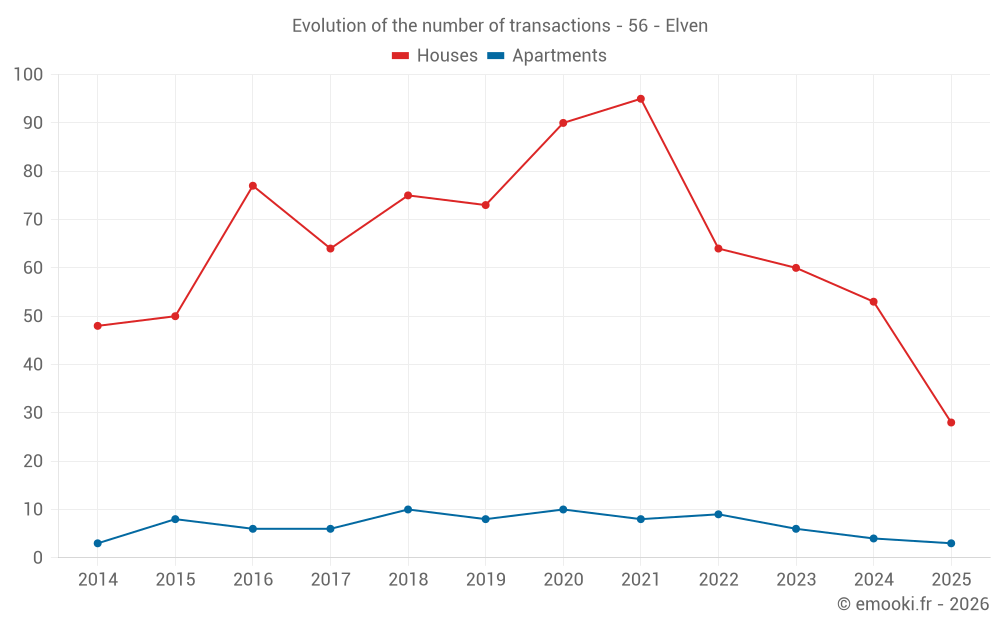
Median price on the 28 transactions of the last 6 months.
from 2 295 to
3 036  /m²
60% of transactions from the 2nd to the 8th deciles.
ApartmentsApartments
2 774  /m²
1-23-45-67-89-10
Reliability 6/10
Median price on the 16 transactions of the last 36 months.
from 2 267 to
2 900  /m²
60% of transactions from the 2nd to the 8th deciles.
DwellingsDwellings
2 611  /m²
1-23-45-67-89-10
Reliability 9/10
Median price on the 31 transactions of the last 6 months.
from 2 271 to
3 000  /m²
60% of transactions from the 2nd to the 8th deciles.
HousesEvolution of the price per m² of houses since...
1 year
+9.5%
2 years
-1.4%
3 years
-0.9%
4 years
+20%
5 years
+39%
6 years
+52%
7 years
+57%
8 years
+63%
9 years
+75%
10 years
+82%
11 years
+49%
The price per m² of houses has decreased by 1.4% since 2 years, but it has increased by 82% in 10 years.

Yearly evolution

Evolution of the median price per m²

Evolution of the median price per m² - 56 - Elven

Evolution of the number of transactions

Warning, last year incomplete. Projections made based on the proportions between semesters of the previous year at the departmental/national level and by type of property.

Evolution of the number of transactions - 56 - Elven

Yearly data

Descending order
Year
Houses
house
transactions
Houses
house
Price per m²
Apartments
apt.
transactions
Apartments
apt.
Price per m²
2025
28
2 676 
3
2 271 
2024
53
2 444 
4
2 898 
2023
60
2 713 
6
2 788 
2022
64
2 700 
9
2 312 
2021
95
2 237 
8
2 160 
2020
90
1 920 
10
1 960 
2019
73
1 761 
8
1 559 
2018
75
1 708 
10
1 764 
2017
64
1 640 
6
1 607 
2016
77
1 532 
6
970 
2015
50
1 473 
8
1 204 
2014
48
1 790 
3
1 671 

Analysis

Structure of prices per m²

Values of price percentiles per m² over the periods used for the estimated price of each type of property.

Structure of transaction amounts

Values of transaction amounts percentiles over the periods used for the estimated price of each type of property.

Transaction amounts and prices per m² by percentile

Ascending order
Percentile
Houses
house
Price per m²
Houses
house
Transaction amount
Apartments
apt.
Price per m²
Apartments
apt.
Transaction amount
10th percentile
1 780 
159 K
2 078 
108 K
20th percentile
2 295 
200 K
2 267 
127 K
30th percentile
2 396 
211 K
2 292 
159 K
40th percentile
2 571 
241 K
2 690 
172 K
50th percentile
2 676 
259 K
2 774 
176 K
60th percentile
2 776 
270 K
2 794 
180 K
70th percentile
2 841 
291 K
2 825 
190 K
80th percentile
3 036 
325 K
2 900 
195 K
90th percentile
3 326 
342 K
3 464 
208 K

National and departmental comparison

Evolution of the median price per m² of houses

Evolution of the median price per m² of apartments

Quarterly evolution

Evolution of the median price per m²

Evolution of the number of transactions

Quarterly data

Descending order
Quarter
Houses
house
transactions
Houses
house
Price per m²
Apartments
apt.
transactions
Apartments
apt.
Price per m²
2025 Q2
10
2 686 
1
2 079 
2025 Q1
18
2 668 
2
2 548 
2024 Q4
15
2 093 
0
--- 
2024 Q3
10
2 578 
0
--- 
2024 Q2
15
2 481 
3
2 690 
2024 Q1
13
2 648 
1
3 106 
2023 Q4
15
2 710 
4
2 788 
2023 Q3
16
2 506 
1
2 824 
2023 Q2
17
2 745 
0
--- 
2023 Q1
12
2 684 
1
1 780 
2022 Q4
13
2 783 
2
2 584 
2022 Q3
21
2 800 
1
2 312 
2022 Q2
17
2 278 
2
2 378 
2022 Q1
13
2 500 
4
2 339 
2021 Q4
25
2 474 
2
1 739 
2021 Q3
26
2 364 
1
2 727 
2021 Q2
26
2 130 
5
2 188 
2021 Q1
18
2 087 
0
--- 
2020 Q4
26
1 928 
8
2 000 
2020 Q3
20
2 016 
0
--- 
2020 Q2
21
1 917 
0
--- 
2020 Q1
23
1 842 
2
1 672 
2019 Q4
17
1 726 
4
1 790 
2019 Q3
17
1 762 
0
--- 
2019 Q2
25
1 640 
2
1 589 
2019 Q1
14
1 834 
2
1 510 
2018 Q4
22
1 628 
5
1 724 
2018 Q3
18
1 831 
1
2 436 
2018 Q2
23
1 663 
3
1 674 
2018 Q1
12
1 654 
1
1 805 
2017 Q4
12
1 686 
1
1 865 
2017 Q3
22
1 746 
1
1 706 
2017 Q2
17
1 600 
1
1 836 
2017 Q1
13
1 504 
3
1 429 
2016 Q4
19
1 527 
3
1 555 
2016 Q3
27
1 557 
0
--- 
2016 Q2
15
1 432 
2
700 
2016 Q1
16
1 575 
1
1 000 
2015 Q4
13
1 358 
0
--- 
2015 Q3
14
1 425 
2
928 
2015 Q2
13
1 813 
3
1 281 
2015 Q1
10
1 643 
3
1 202 
2014 Q4
16
1 779 
0
--- 
2014 Q3
12
1 790 
1
1 758 
2014 Q2
9
1 824 
0
--- 
2014 Q1
11
1 777 
2
1 530 

Overview of the latest real estate transactions

The following list is an anonymized overview of the latest transactions. For more details and to find all transactions, please use the map to view transactions by plot or the transaction search page for a search by criteria.

2025-06-30
1 011 050 
2 956  /m²(342 m²)
Sale
Houses
House
7 rooms
342 m2
Land
1040 m2
-Sols
Land
723 m2
-Terrains d'agrément
Land
453 m2
-Terrains d'agrément
Land
767 m2
-Terrains d'agrément
2025-06-30
259 500 
Sale
Land
341 m2
-Terrains à bâtir
2025-06-23
2 000 
Sale
Land
2680 m2
-Landes
Land
1501 m2
-Landes
2025-06-20
325 000 
3 385  /m²(96 m²)
Sale
Land
4 m2
-Sols
Houses
House
3 rooms
96 m2
Land
481 m2
-Sols
Land
345 m2
-Sols
2025-06-13
47 039 
Sale
Land
510 m2
-Landes
Land
4823 m2
-Terres
Land
926 m2
-Terres
Land
5211 m2
-Terres
Land
9793 m2
-Prés
Land
4028 m2
-Terres
Land
4949 m2
-Landes
Land
2034 m2
-Terres
Land
7295 m2
-Terres
Land
5913 m2
-Terres
Land
765 m2
-Prés
Land
1415 m2
-Prés
Land
3180 m2
-Prés
Land
4858 m2
-Prés
2025-06-10
286 000 
2 832  /m²(101 m²)
Sale
Houses
House
5 rooms
101 m2
Land
184 m2
-Sols
Land
199 m2
-Sols
2025-06-04
44 000 
Sale
Land
61400 m2
-Futaies résineuses
2025-06-03
329 000 
2 611  /m²(126 m²)
Sale
Houses
House
6 rooms
126 m2
2 outbuildings
Land
656 m2
-Sols
2025-06-03
237 500 
2 762  /m²(86 m²)
Sale
Houses
House
5 rooms
86 m2
Land
504 m2
-Sols
2025-05-31
205 000 
3 060  /m²(67 m²)
Sale
Houses
House
3 rooms
67 m2
Land
205 m2
-Sols
2025-05-28
200 000 
Sale
Land
781 m2
-Prés
Land
605 m2
-Prés
Land
640 m2
-Prés
Land
283 m2
-Prés
2025-04-30
364 000 
Sale
Land
464 m2
-Sols
Land
410 m2
-Terrains à bâtir
Land
13 m2
-Sols
Land
58 m2
-Sols
2025-04-30
94 050 
Sale
Land
494 m2
-Terrains à bâtir
2025-04-29
355 
Sale
Land
710 m2
-Terres
2025-04-25
130 000 
1 150  /m²(113 m²)
Sale
Houses
House
5 rooms
113 m2
Land
500 m2
-Sols
Land
1017 m2
-Terrains d'agrément
2025-04-24
185 000 
2 079  /m²(89 m²)
Sale
1 outbuilding
Apartments
Apartment
4 rooms
89 m2
2025-04-24
15 300 
Sale
Land
102 m2
-Sols
2025-04-17
262 500 
1 098  /m²(239 m²)
Sale
Houses
House
9 rooms
239 m2
1 outbuilding
Land
570 m2
-Terrains d'agrément
Land
500 m2
-Sols
2025-04-15
150 
Sale
Land
491 m2
-Terrains d'agrément
Land
519 m2
-Terrains d'agrément
2025-04-04
292 000 
2 454  /m²(119 m²)
Sale
Houses
House
5 rooms
119 m2
Land
385 m2
-Sols
1701 transactions listed in the municipality

Morbihan (56)

Most expensive cities

City
name
Descending orderHouses
house
Price per m²
6 560 
5 843 
5 741 
5 625 
5 440 
5 366 
5 319 
5 302 
5 112 
City
name
Descending orderApartments
apt.
Price per m²
6 879 
5 986 
5 736 
5 232 
5 000 
4 948 
4 613 

Least expensive cities

City
name
Ascending orderHouses
house
Price per m²
747 
788 
904 
920 
921 
949 
1 020 
City
name
Ascending orderApartments
apt.
Price per m²
167 
325 
368 
388 
417 
430 
432 
458 
475 
482