Real estate price map
Real estate price map in the municipality of Saint-Remy-sur-Bussy, choose a section to see transactions by parcel.
Marne (51)
Price per m² in Saint-Remy-sur-Bussy
Median price of real estate
in the municipality of Saint-Remy-sur-Bussy
Houses
1 256 € /m²
Reliability 4/10
Median price on the 12 transactions of the last 60 months.
from 835 to
1 616 € /m²
1 616 € /m²
60% of transactions from the 2nd to the 8th deciles.
Yearly evolution
Evolution of the median price per m²

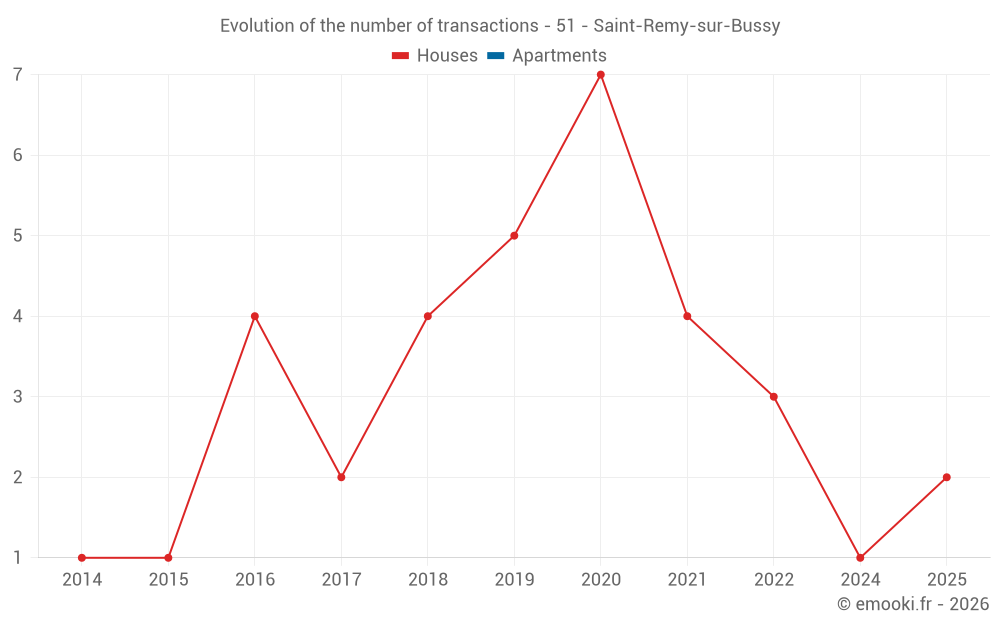
Evolution of the number of transactions
Warning, last year incomplete. Projections made based on the proportions between semesters of the previous year at the departmental/national level and by type of property.
Yearly data
Year
house
transactions
transactions
house
Price per m²
Price per m²
apt.
transactions
transactions
apt.
Price per m²
Price per m²
2025
2
1 256 €
0
--- €
2024
1
861 €
0
--- €
2023
0
--- €
0
--- €
2022
3
758 €
0
--- €
2021
4
1 570 €
0
--- €
2020
7
829 €
0
--- €
2019
5
1 582 €
0
--- €
2018
4
1 394 €
0
--- €
2017
2
1 092 €
0
--- €
2016
4
732 €
0
--- €
2015
1
1 893 €
0
--- €
2014
1
708 €
0
--- €
Analysis
Structure of prices per m²
Values of price percentiles per m² over the periods used for the estimated price of each type of property.
Structure of transaction amounts
Values of transaction amounts percentiles over the periods used for the estimated price of each type of property.
Transaction amounts and prices per m² by percentile
Percentile
house
Price per m²
Price per m²
house
Transaction amount
Transaction amount
apt.
Price per m²
Price per m²
apt.
Transaction amount
Transaction amount
10th percentile
765 €
71 000 €
--- €
--- €
20th percentile
835 €
98 400 €
--- €
--- €
30th percentile
870 €
108 K€
--- €
--- €
40th percentile
944 €
137 K€
--- €
--- €
50th percentile
1 256 €
159 K€
--- €
--- €
60th percentile
1 504 €
166 K€
--- €
--- €
70th percentile
1 560 €
176 K€
--- €
--- €
80th percentile
1 616 €
183 K€
--- €
--- €
90th percentile
1 980 €
198 K€
--- €
--- €
National and departmental comparison
Evolution of the median price per m² of houses
Evolution of the median price per m² of apartments
Quarterly evolution
Evolution of the median price per m²
Evolution of the number of transactions
Quarterly data
Quarter
house
transactions
transactions
house
Price per m²
Price per m²
apt.
transactions
transactions
apt.
Price per m²
Price per m²
2025 Q2
1
1 024 €
0
--- €
2025 Q1
1
1 488 €
0
--- €
2024 Q1
1
861 €
0
--- €
2022 Q3
3
758 €
0
--- €
2021 Q4
2
1 258 €
0
--- €
2021 Q3
1
2 019 €
0
--- €
2021 Q1
1
1 515 €
0
--- €
2020 Q4
1
2 044 €
0
--- €
2020 Q3
1
829 €
0
--- €
2020 Q1
5
671 €
0
--- €
2019 Q4
1
1 372 €
0
--- €
2019 Q3
4
1 609 €
0
--- €
2018 Q4
2
1 275 €
0
--- €
2018 Q3
2
1 394 €
0
--- €
2017 Q2
2
1 092 €
0
--- €
2016 Q4
2
732 €
0
--- €
2016 Q3
1
677 €
0
--- €
2016 Q1
1
1 185 €
0
--- €
2015 Q1
1
1 893 €
0
--- €
2014 Q1
1
708 €
0
--- €
Overview of the latest real estate transactions
The following list is an anonymized overview of the latest transactions. For more details and to find all transactions, please use the map to view transactions by plot or the transaction search page for a search by criteria.
2025-06-27
162 850 €1 024 € /m²(159 m²)
Sale
House
6 rooms
159 m2
Land
298 m2
-Taillis simples
Land
503 m2
-Sols
2025-04-10
150 €Sale
Land
15 m2
-Sols
2025-04-02
220 €Sale
Land
22 m2
-Sols
2025-04-02
120 €Sale
Land
9 m2
-Sols
Land
3 m2
-Sols
2025-03-13
125 000 €1 488 € /m²(84 m²)
Sale
House
5 rooms
84 m2
Land
810 m2
-Sols
2025-01-14
3 000 €Sale
Land
2705 m2
-Terres
2024-12-19
3 200 €Sale
Land
640 m2
-Sols
2024-11-25
21 035 €Sale
Land
213 m2
-Jardins
Land
388 m2
-Jardins
2024-10-22
28 000 €Sale
Land
259 m2
-Sols
Land
1000 m2
-Jardins
2024-10-14
45 000 €Sale
2 outbuildings
Land
770 m2
-Sols
2024-03-20
155 000 €861 € /m²(180 m²)
Sale
House
6 rooms
180 m2
1 outbuilding
Land
1349 m2
-Sols
Land
266 m2
-Sols
2024-02-23
19 400 €Sale
Land
19360 m2
-Terres
2024-02-16
92 705 €Sale
Land
6165 m2
-Terres
Land
6164 m2
-Terres
Land
24510 m2
-Terres
Land
6780 m2
-Terres
Land
12020 m2
-Terres
2024-01-16
300 €Exchange
Land
46 m2
-Sols
2024-01-16
1 €Sale
Land
46 m2
-Sols
Land
363 m2
-Sols
Land
248 m2
-Sols
2024-01-12
31 700 €Sale
Land
6080 m2
-Terres
Land
11730 m2
-Terres
2023-09-21
4 704 €Sale
Land
3360 m2
-Terres
2023-06-20
27 000 €Sale
Land
12348 m2
-Terres
Land
66014 m2
-Futaies résineuses
2023-02-15
1 289 060 €Sale
Land
10637 m2
-Sols
Land
4097 m2
-Sols
Land
7299 m2
-Terres
Land
6501 m2
-Terres
2023-01-19
70 000 €127 € /m²(550 m²)
Sale
Commercial property
550 m2
Land
3111 m2
-Terres
Land
4919 m2
-Sols
96 transactions listed in the municipality
Compare with neighboring municipalities
City
name
name
house
Price per m²
Price per m²
apt.
Price per m²
Price per m²
City information
Zip code
- 51600 ST REMY SUR BUSSY
Data source & update
- Latest publication of the property value request (DVF) database made available by the DGFiP on October 19, 2025, covering transactions up to 06/30/2025:
- Administrative/cadastral division as of September 1, 2025, and municipal movements as of January 1, 2025: