Real estate price map
Real estate price map in the municipality of Saint-Quentin-sur-Coole, choose a section to see transactions by parcel.
Marne (51)
Price per m² in Saint-Quentin-sur-Coole
Median price of real estate
in the municipality of Saint-Quentin-sur-Coole
Houses
1 727 € /m²
Reliability 3/10
Median price on the 7 transactions of the last 72 months.
Yearly evolution
Evolution of the median price per m²

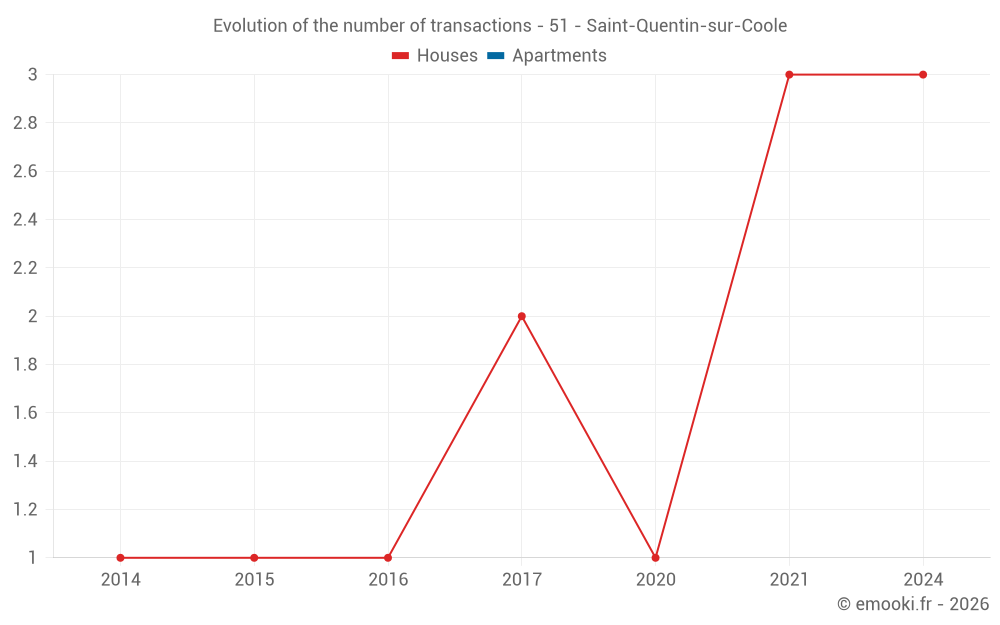
Evolution of the number of transactions
Warning, last year incomplete. Projections made based on the proportions between semesters of the previous year at the departmental/national level and by type of property.
Yearly data
Year
house
transactions
transactions
house
Price per m²
Price per m²
apt.
transactions
transactions
apt.
Price per m²
Price per m²
2025
0
--- €
0
--- €
2024
3
2 507 €
0
--- €
2023
0
--- €
0
--- €
2022
0
--- €
0
--- €
2021
3
1 218 €
0
--- €
2020
1
1 129 €
0
--- €
2019
0
--- €
0
--- €
2018
0
--- €
0
--- €
2017
2
1 908 €
0
--- €
2016
1
1 051 €
0
--- €
2015
1
1 012 €
0
--- €
2014
1
976 €
0
--- €
Analysis
Structure of prices per m²
Values of price percentiles per m² over the periods used for the estimated price of each type of property.
Structure of transaction amounts
Values of transaction amounts percentiles over the periods used for the estimated price of each type of property.
Transaction amounts and prices per m² by percentile
Percentile
house
Price per m²
Price per m²
house
Transaction amount
Transaction amount
apt.
Price per m²
Price per m²
apt.
Transaction amount
Transaction amount
10th percentile
1 067 €
143 K€
--- €
--- €
20th percentile
1 147 €
146 K€
--- €
--- €
30th percentile
1 200 €
148 K€
--- €
--- €
40th percentile
1 422 €
157 K€
--- €
--- €
50th percentile
1 727 €
168 K€
--- €
--- €
60th percentile
2 181 €
209 K€
--- €
--- €
70th percentile
2 489 €
240 K€
--- €
--- €
80th percentile
2 502 €
250 K€
--- €
--- €
90th percentile
2 631 €
275 K€
--- €
--- €
National and departmental comparison
Evolution of the median price per m² of houses
Evolution of the median price per m² of apartments
Quarterly evolution
Evolution of the median price per m²
Evolution of the number of transactions
Quarterly data
Quarter
house
transactions
transactions
house
Price per m²
Price per m²
apt.
transactions
transactions
apt.
Price per m²
Price per m²
2024 Q3
1
2 484 €
0
--- €
2024 Q2
2
2 662 €
0
--- €
2021 Q3
1
1 218 €
0
--- €
2021 Q1
2
1 350 €
0
--- €
2020 Q3
1
1 129 €
0
--- €
2017 Q2
2
1 908 €
0
--- €
2016 Q2
1
1 051 €
0
--- €
2015 Q3
1
1 012 €
0
--- €
2014 Q4
1
976 €
0
--- €
Overview of the latest real estate transactions
The following list is an anonymized overview of the latest transactions. For more details and to find all transactions, please use the map to view transactions by plot or the transaction search page for a search by criteria.
2025-04-23
15 000 €Sale
Land
6486 m2
-Terrains à bâtir
2025-04-23
331 608 €Sale
Land
20502 m2
-Terres
Land
893 m2
-Landes
/Friche
Land
1736 m2
-Terres
Land
577 m2
-Landes
/Friche
Land
23223 m2
-Terres
Land
1849 m2
-Terres
Land
53188 m2
-Terres
Land
640 m2
-Landes
/Friche
Land
2817 m2
-Terres
Land
2139 m2
-Terres
Land
6169 m2
-Terres
Land
9478 m2
-Terres
Land
14809 m2
-Terres
Land
68530 m2
-Terres
Land
1260 m2
-Terres
2025-03-28
7 575 €Sale
Land
2554 m2
-Terres
Land
2037 m2
-Terres
2025-02-07
500 €Sale
Land
611 m2
-Taillis sous futaie
2024-09-11
18 700 €Sale
Land
84 m2
-Jardins
2024-08-01
308 030 €2 484 € /m²(124 m²)
Sale
House
5 rooms
124 m2
1 outbuilding
Land
871 m2
-Sols
Land
102 m2
-Sols
2024-07-10
3 000 €Sale
Land
77 m2
-Taillis sous futaie
Land
404 m2
-Terres
Land
429 m2
-Terres
Land
99 m2
-Taillis sous futaie
2024-06-28
18 000 €Sale
Land
81273 m2
-Futaies résineuses
/Pins
2024-04-19
253 600 €2 818 € /m²(90 m²)
Sale
House
4 rooms
90 m2
3 outbuildings
Land
839 m2
-Sols
Land
600 m2
-Jardins
Land
483 m2
-Taillis sous futaie
Land
2519 m2
-Terres
2024-04-03
168 000 €2 507 € /m²(67 m²)
Sale
House
3 rooms
67 m2
Land
107 m2
-Sols
Land
1408 m2
-Terres
2023-11-07
4 000 €Sale
Land
5221 m2
-Taillis sous futaie
2023-05-03
10 000 €Sale
Land
1360 m2
-Terres
2023-02-15
19 976 €Sale
Land
3815 m2
-Terres
Land
4147 m2
-Terres
2023-01-12
4 000 €Sale
Land
2654 m2
-Terres
2022-06-08
44 000 €Sale
Land
280 m2
-Terres
Land
1090 m2
-Sols
Land
1716 m2
-Terres
2022-03-31
11 741 €Sale
Land
9784 m2
-Terres
2022-02-03
12 500 €Sale
Land
880 m2
-Terres
Land
274 m2
-Taillis sous futaie
Land
2308 m2
-Terres
Land
136 m2
-Taillis sous futaie
2021-09-09
145 000 €1 218 € /m²(119 m²)
Sale
House
5 rooms
119 m2
Land
738 m2
-Sols
2021-04-02
51 500 €Sale
Land
1969 m2
-Terres
Land
1781 m2
-Peupleraies
Land
141 m2
-Taillis sous futaie
Land
2204 m2
-Terres
Land
148 m2
-Vergers
2021-03-17
149 000 €974 € /m²(153 m²)
Sale
House
6 rooms
153 m2
2 outbuildings
Land
1500 m2
-Sols
Land
2528 m2
-Jardins
41 transactions listed in the municipality
Compare with neighboring municipalities
City
name
name
house
Price per m²
Price per m²
apt.
Price per m²
Price per m²
City information
Zip code
- 51240 ST QUENTIN SUR COOLE
Data source & update
- Latest publication of the property value request (DVF) database made available by the DGFiP on October 19, 2025, covering transactions up to 06/30/2025:
- Administrative/cadastral division as of September 1, 2025, and municipal movements as of January 1, 2025: