Median price of real estate
in the municipality of Saint-Céré
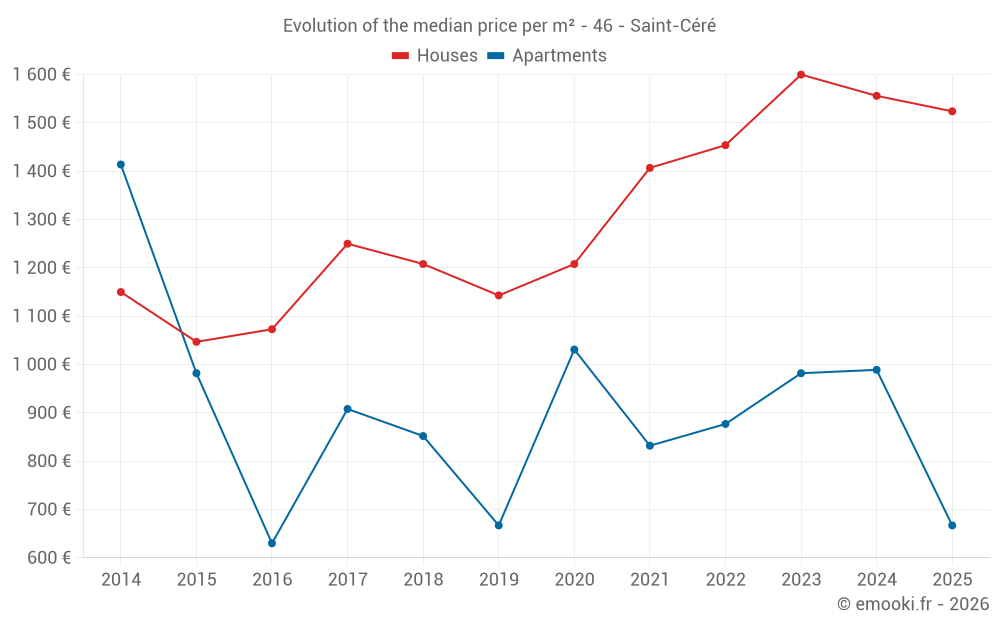
Houses
1 524 € /m²
Reliability 9/10
Median price on the 26 transactions of the last 6 months.
from 1 044 to
2 056 € /m²
2 056 € /m²
60% of transactions from the 2nd to the 8th deciles.
Apartments
1 008 € /m²
Reliability 7/10
Median price on the 17 transactions of the last 24 months.
from 294 to
1 312 € /m²
1 312 € /m²
60% of transactions from the 2nd to the 8th deciles.
Dwellings
1 453 € /m²
Reliability 9/10
Median price on the 29 transactions of the last 6 months.
from 1 014 to
2 002 € /m²
2 002 € /m²
60% of transactions from the 2nd to the 8th deciles.