Median price of real estate
in the municipality of Sabadel-Lauzès
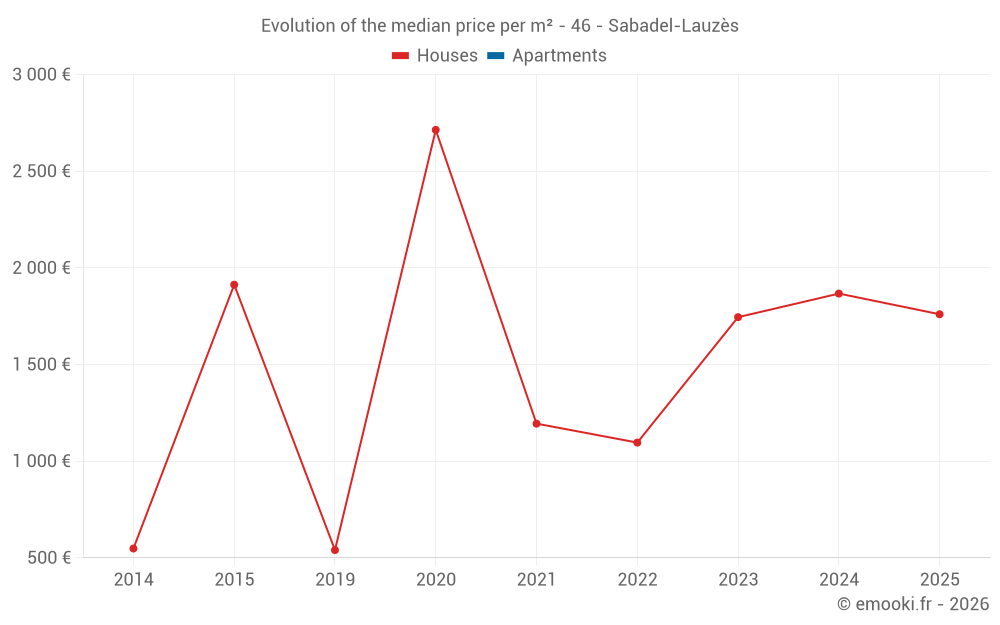
Houses
1 550 € /m²
Reliability 5/10
Median price on the 12 transactions of the last 48 months.
from 1 181 to
1 776 € /m²
1 776 € /m²
60% of transactions from the 2nd to the 8th deciles.