Real estate price map
Real estate price map in the municipality of Miers, choose a section to see transactions by parcel.
Lot (46)
Price per m² in Miers
Median price of real estate
in the municipality of Miers
Houses
1 714 € /m²
Reliability 6/10
Median price on the 17 transactions of the last 36 months.
from 1 013 to
2 107 € /m²
2 107 € /m²
60% of transactions from the 2nd to the 8th deciles.
Apartments
849 € /m²
Reliability 1/10
Median price on the 3 transactions of the last 120 months.
Dwellings
1 714 € /m²
Reliability 6/10
Median price on the 19 transactions of the last 36 months.
from 982 to
2 072 € /m²
2 072 € /m²
60% of transactions from the 2nd to the 8th deciles.
Yearly evolution
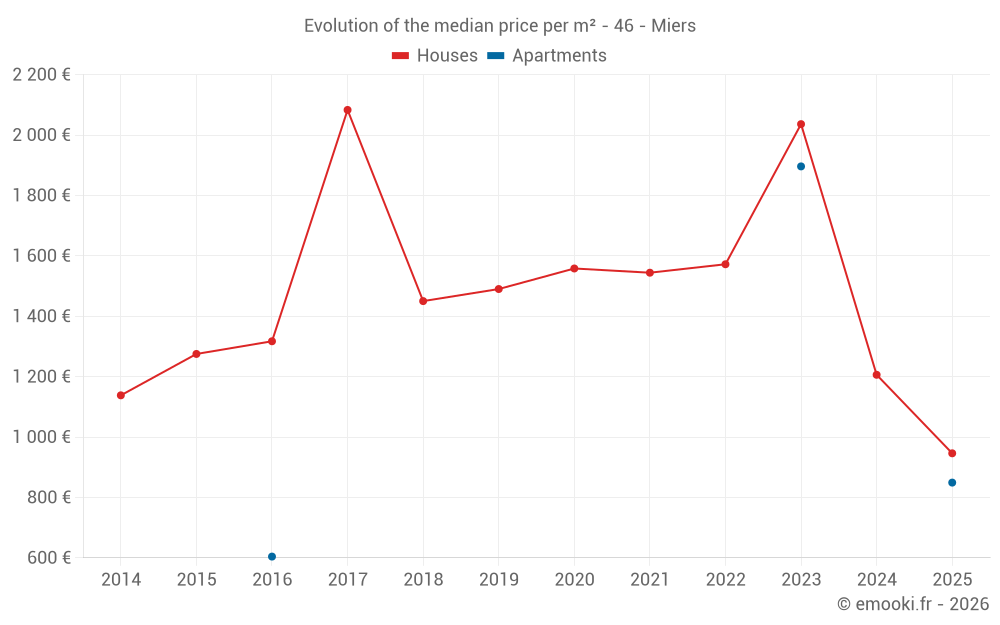
Evolution of the median price per m²
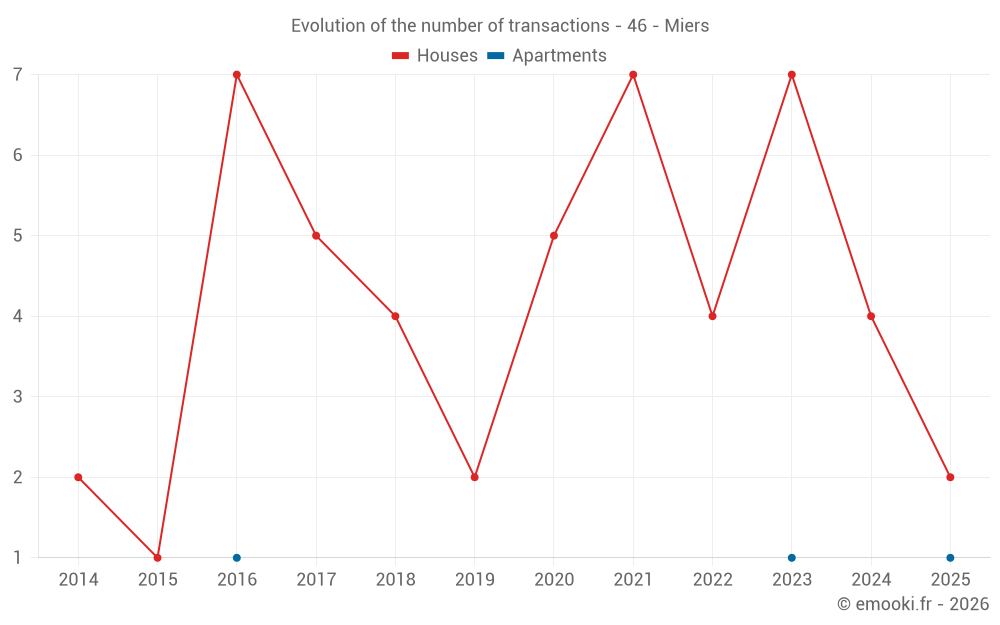
Evolution of the number of transactions
Warning, last year incomplete. Projections made based on the proportions between semesters of the previous year at the departmental/national level and by type of property.
Yearly data
Year
house
transactions
transactions
house
Price per m²
Price per m²
apt.
transactions
transactions
apt.
Price per m²
Price per m²
2025
2
946 €
1
849 €
2024
4
1 206 €
0
--- €
2023
7
2 036 €
1
1 896 €
2022
4
1 572 €
0
--- €
2021
7
1 544 €
0
--- €
2020
5
1 558 €
0
--- €
2019
2
1 490 €
0
--- €
2018
4
1 450 €
0
--- €
2017
5
2 083 €
0
--- €
2016
7
1 317 €
1
604 €
2015
1
1 275 €
0
--- €
2014
2
1 138 €
0
--- €
Analysis
Structure of prices per m²
Values of price percentiles per m² over the periods used for the estimated price of each type of property.
Structure of transaction amounts
Values of transaction amounts percentiles over the periods used for the estimated price of each type of property.
Transaction amounts and prices per m² by percentile
Percentile
house
Price per m²
Price per m²
house
Transaction amount
Transaction amount
apt.
Price per m²
Price per m²
apt.
Transaction amount
Transaction amount
10th percentile
930 €
64 800 €
653 €
90 331 €
20th percentile
1 013 €
81 020 €
702 €
90 662 €
30th percentile
1 287 €
91 420 €
751 €
90 993 €
40th percentile
1 391 €
154 K€
800 €
91 324 €
50th percentile
1 714 €
213 K€
849 €
91 655 €
60th percentile
1 837 €
231 K€
1 058 €
124 K€
70th percentile
1 999 €
254 K€
1 268 €
157 K€
80th percentile
2 107 €
300 K€
1 477 €
189 K€
90th percentile
2 362 €
346 K€
1 687 €
222 K€
National and departmental comparison
Evolution of the median price per m² of houses
Evolution of the median price per m² of apartments
Quarterly evolution
Evolution of the median price per m²
Evolution of the number of transactions
Quarterly data
Quarter
house
transactions
transactions
house
Price per m²
Price per m²
apt.
transactions
transactions
apt.
Price per m²
Price per m²
2025 Q2
2
946 €
0
--- €
2025 Q1
0
--- €
1
849 €
2024 Q4
1
1 349 €
0
--- €
2024 Q3
1
2 125 €
0
--- €
2024 Q2
1
1 064 €
0
--- €
2024 Q1
1
954 €
0
--- €
2023 Q4
3
2 353 €
0
--- €
2023 Q2
1
2 036 €
0
--- €
2023 Q1
3
1 860 €
1
1 896 €
2022 Q4
2
1 379 €
0
--- €
2022 Q3
2
1 572 €
0
--- €
2021 Q4
1
1 972 €
0
--- €
2021 Q3
2
1 325 €
0
--- €
2021 Q2
3
794 €
0
--- €
2021 Q1
1
1 836 €
0
--- €
2020 Q4
4
1 328 €
0
--- €
2020 Q2
1
1 598 €
0
--- €
2019 Q4
1
955 €
0
--- €
2019 Q3
1
2 026 €
0
--- €
2018 Q3
2
953 €
0
--- €
2018 Q1
2
2 404 €
0
--- €
2017 Q4
2
2 205 €
0
--- €
2017 Q3
2
1 264 €
0
--- €
2017 Q1
1
2 102 €
0
--- €
2016 Q4
5
1 317 €
1
604 €
2016 Q2
1
562 €
0
--- €
2016 Q1
1
1 488 €
0
--- €
2015 Q4
1
1 275 €
0
--- €
2014 Q4
1
1 141 €
0
--- €
2014 Q2
1
1 136 €
0
--- €
Overview of the latest real estate transactions
The following list is an anonymized overview of the latest transactions. For more details and to find all transactions, please use the map to view transactions by plot or the transaction search page for a search by criteria.
2025-06-20
300 000 €893 € /m²(336 m²)
Sale
House
2 rooms
28 m2
House
4 rooms
140 m2
House
4 rooms
140 m2
House
2 rooms
28 m2
6 outbuildings
Land
16471 m2
-Landes
Land
2348 m2
-Sols
Land
21311 m2
-Landes
/Pacage
2025-06-11
3 500 €Sale
Land
6280 m2
-Prés
2025-05-07
65 000 €1 000 € /m²(65 m²)
Sale
House
3 rooms
65 m2
Land
135 m2
-Sols
Land
16 m2
-Sols
2025-05-05
16 000 €Sale
Land
1000 m2
-Terres
2025-03-28
45 000 €Sale
Land
2410 m2
-Prés
Land
392 m2
-Sols
Land
202 m2
-Jardins
/Jardin potager
Land
294 m2
-Landes
2025-03-26
24 €Sale
Land
800 m2
-Taillis simples
2025-03-26
78 €Sale
Land
2600 m2
-Landes
2025-03-25
91 655 €849 € /m²(108 m²)
Sale
Apartment
4 rooms
108 m2
Land
41 m2
-Sols
Land
132 m2
-Terres
2025-01-29
17 500 €Sale
Land
6823 m2
-Terres
Land
3298 m2
-Vignes
Land
3420 m2
-Prés
Land
866 m2
-Prés
Land
4848 m2
-Prés
Land
16 m2
-Sols
Land
19667 m2
-Prés
Land
2270 m2
-Prés
2025-01-23
1 340 €Sale
Land
1025 m2
-Prés
Land
4095 m2
-Landes
2024-11-05
70 100 €276 € /m²(254 m²)
449 € /m²(156 m²)
Sale
House
6 rooms
156 m2
Commercial property
98 m2
Land
734 m2
-Sols
Land
40 m2
-Sols
Land
10 m2
-Sols
Land
140 m2
-Sols
Land
59 m2
-Sols
2024-10-18
143 000 €1 349 € /m²(106 m²)
Sale
House
5 rooms
106 m2
Land
365 m2
-Sols
Land
18 m2
-Landes
Land
17 m2
-Prés
Land
284 m2
-Landes
Land
1131 m2
-Prés
2024-10-14
18 000 €Sale
Land
1715 m2
-Landes
/Pacage
Land
1965 m2
-Landes
Land
840 m2
-Landes
Land
2830 m2
-Landes
Land
11540 m2
-Terres
Land
1430 m2
-Landes
Land
2525 m2
-Landes
/Pacage
Land
6285 m2
-Terres
Land
2095 m2
-Terres
Land
5710 m2
-Taillis simples
Land
7870 m2
-Taillis simples
Land
13910 m2
-Taillis simples
2024-07-19
212 500 €2 125 € /m²(100 m²)
Sale
House
4 rooms
100 m2
Land
2300 m2
-Sols
2024-06-20
85 100 €1 064 € /m²(80 m²)
Sale
House
4 rooms
80 m2
Land
171 m2
-Sols
Land
233 m2
-Jardins
/Jardin potager
Land
2 m2
-Sols
2024-05-15
1 040 €Sale
Land
208 m2
-Landes
2024-04-08
12 000 €Sale
Land
3623 m2
-Terres
Land
3622 m2
-Terres
Land
3735 m2
-Landes
/Pacage
Land
315 m2
-Landes
/Pacage
Land
4813 m2
-Terres
2024-03-27
15 €Sale
Land
14 m2
-Sols
2024-03-26
500 €Sale
Land
24 m2
-Jardins
/Jardin potager
2024-02-28
5 600 €Sale
Land
280 m2
-Jardins
/Jardin potager
162 transactions listed in the municipality
Compare with neighboring municipalities
City
name
name
house
Price per m²
Price per m²
apt.
Price per m²
Price per m²
City information
Zip code
- 46500 MIERS
Data source & update
- Latest publication of the property value request (DVF) database made available by the DGFiP on October 19, 2025, covering transactions up to 06/30/2025:
- Administrative/cadastral division as of September 1, 2025, and municipal movements as of January 1, 2025: