emooki
HomePrice mapTransactions
🇬🇧 English🇫🇷 Français🇩🇪 Deutsch🇪🇸 Español🇮🇹 Italiano

Real estate price map


Real estate price map in the municipality of Vénérieu.

Isère (38)
Vénérieu

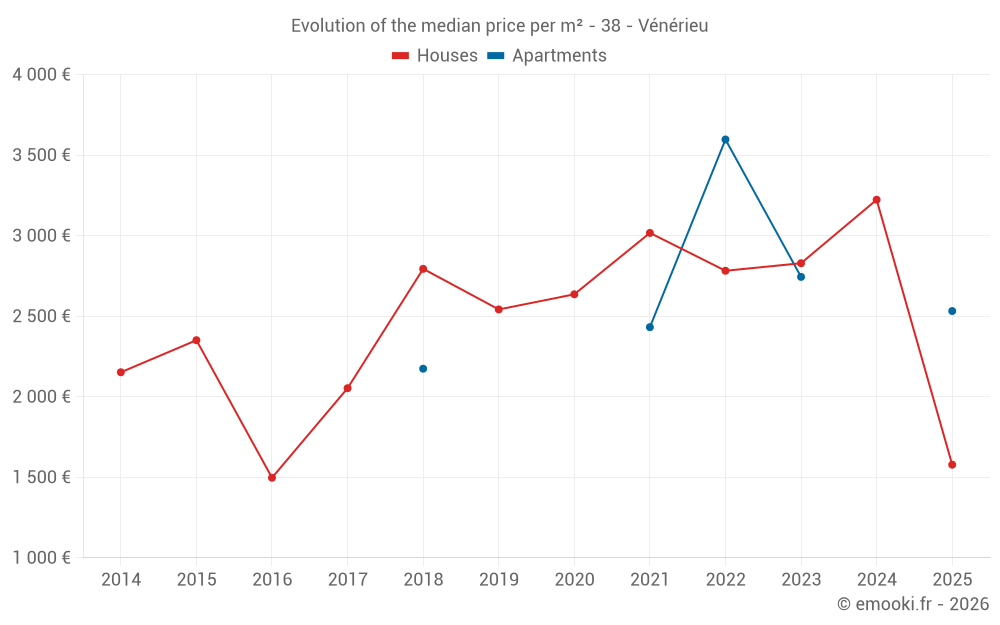
Median price of real estate
in the municipality of Vénérieu

HousesHouses
2 879  /m²
1-23-45-67-89-10
Reliability 6/10
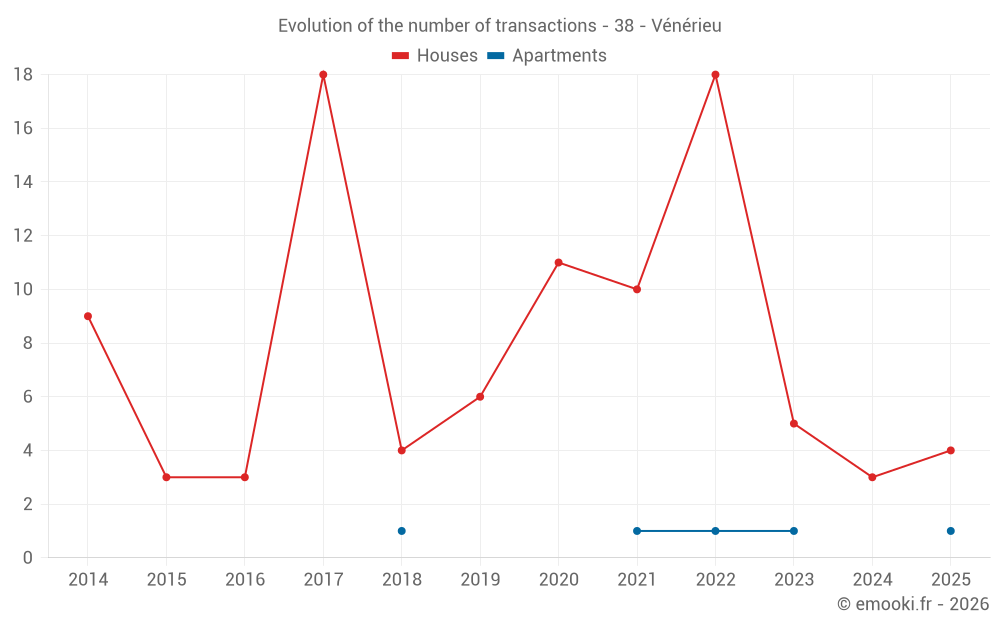
Median price on the 20 transactions of the last 36 months.
from 1 571 to
3 408  /m²
60% of transactions from the 2nd to the 8th deciles.
ApartmentsApartments
2 532  /m²
1-23-45-67-89-10
Reliability 2/10
Median price on the 5 transactions of the last 96 months.
DwellingsDwellings
2 829  /m²
1-23-45-67-89-10
Reliability 6/10
Median price on the 23 transactions of the last 36 months.
from 1 603 to
3 423  /m²
60% of transactions from the 2nd to the 8th deciles.
HousesEvolution of the price per m² of houses since...
1 year
--
2 years
--
3 years
--
4 years
--
5 years
--
6 years
--
7 years
--
8 years
--
9 years
--
10 years
--
11 years
--
ApartmentsEvolution of the price per m² of apartments since...
1 year
--
2 years
--
3 years
--
4 years
--
5 years
--
6 years
--
7 years
--
8 years
--
9 years
--
10 years
--
11 years
--

Yearly evolution

Evolution of the median price per m²

Evolution of the number of transactions

Warning, last year incomplete. Projections made based on the proportions between semesters of the previous year at the departmental/national level and by type of property.

Yearly data

Descending order
Year
Houses
house
transactions
Houses
house
Price per m²
Apartments
apt.
transactions
Apartments
apt.
Price per m²
2025
4
1 578 
1
2 532 
2024
3
3 223 
0
--- 
2023
5
2 829 
1
2 744 
2022
18
2 782 
1
3 597 
2021
10
3 017 
1
2 432 
2020
11
2 636 
0
--- 
2019
6
2 542 
0
--- 
2018
4
2 794 
1
2 174 
2017
18
2 053 
0
--- 
2016
3
1 497 
0
--- 
2015
3
2 351 
0
--- 
2014
9
2 152 
0
--- 

Analysis

Structure of prices per m²

Values of price percentiles per m² over the periods used for the estimated price of each type of property.

Structure of transaction amounts

Values of transaction amounts percentiles over the periods used for the estimated price of each type of property.

Transaction amounts and prices per m² by percentile

Ascending order
Percentile
Houses
house
Price per m²
Houses
house
Transaction amount
Apartments
apt.
Price per m²
Apartments
apt.
Transaction amount
10th percentile
1 479 
149 K
2 277 
165 K
20th percentile
1 571 
192 K
2 380 
172 K
30th percentile
2 205 
237 K
2 452 
180 K
40th percentile
2 648 
251 K
2 492 
189 K
50th percentile
2 879 
262 K
2 532 
198 K
60th percentile
3 173 
286 K
2 617 
199 K
70th percentile
3 336 
296 K
2 702 
200 K
80th percentile
3 408 
311 K
2 915 
212 K
90th percentile
3 521 
348 K
3 256 
235 K

National and departmental comparison

Evolution of the median price per m² of houses

Evolution of the median price per m² of apartments

Quarterly evolution

Evolution of the median price per m²

Evolution of the number of transactions

Quarterly data

Descending order
Quarter
Houses
house
transactions
Houses
house
Price per m²
Apartments
apt.
transactions
Apartments
apt.
Price per m²
2025 Q2
2
1 559 
1
2 532 
2025 Q1
2
2 330 
0
--- 
2024 Q2
1
3 223 
0
--- 
2024 Q1
2
3 165 
0
--- 
2023 Q4
1
4 667 
0
--- 
2023 Q3
1
2 450 
0
--- 
2023 Q2
1
2 829 
0
--- 
2023 Q1
2
3 179 
1
2 744 
2022 Q4
6
3 344 
0
--- 
2022 Q3
2
1 916 
1
3 597 
2022 Q2
7
2 413 
0
--- 
2022 Q1
3
2 983 
0
--- 
2021 Q4
1
3 050 
0
--- 
2021 Q3
3
2 993 
0
--- 
2021 Q2
4
3 078 
1
2 432 
2021 Q1
2
2 997 
0
--- 
2020 Q4
3
2 725 
0
--- 
2020 Q3
3
2 636 
0
--- 
2020 Q2
2
2 926 
0
--- 
2020 Q1
3
1 728 
0
--- 
2019 Q4
1
2 556 
0
--- 
2019 Q3
3
3 020 
0
--- 
2019 Q2
2
2 026 
0
--- 
2018 Q4
1
3 010 
0
--- 
2018 Q3
2
2 574 
0
--- 
2018 Q1
1
2 998 
1
2 174 
2017 Q4
4
2 178 
0
--- 
2017 Q3
4
2 047 
0
--- 
2017 Q2
5
2 082 
0
--- 
2017 Q1
5
1 904 
0
--- 
2016 Q4
2
2 018 
0
--- 
2016 Q2
1
1 497 
0
--- 
2015 Q3
3
2 351 
0
--- 
2014 Q4
2
2 404 
0
--- 
2014 Q3
1
2 756 
0
--- 
2014 Q2
2
1 489 
0
--- 
2014 Q1
4
1 016 
0
--- 

Isère (38)

Most expensive cities

City
name
Descending orderHouses
house
Price per m²
8 262 
4 917 
4 777 
4 663 
4 610 
4 575 
4 506 
City
name
Descending orderApartments
apt.
Price per m²
7 647 
6 370 
5 636 
4 866 
4 524 
4 492 
4 249 
4 234 
3 958 

Least expensive cities

City
name
Ascending orderHouses
house
Price per m²
502 
722 
975 
1 133 
1 198 
1 237 
City
name
Ascending orderApartments
apt.
Price per m²
475 
483 
541 
562