emooki
HomePrice mapTransactions
🇬🇧 English🇫🇷 Français🇩🇪 Deutsch🇪🇸 Español🇮🇹 Italiano

Real estate price map


Real estate price map in the municipality of Saint-Quentin-Fallavier, choose a section to see transactions by parcel.

Isère (38)

Saint-Quentin-Fallavier - Real estate price m²

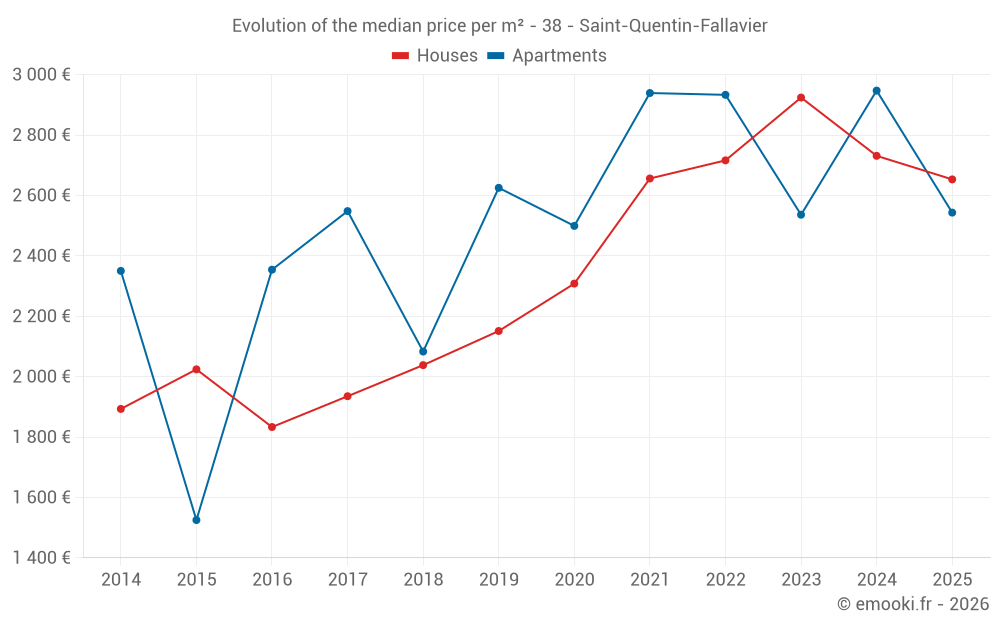
Median price of real estate
in the municipality of Saint-Quentin-Fallavier

HousesHouses
2 653  /m²
1-23-45-67-89-10
Reliability 9/10
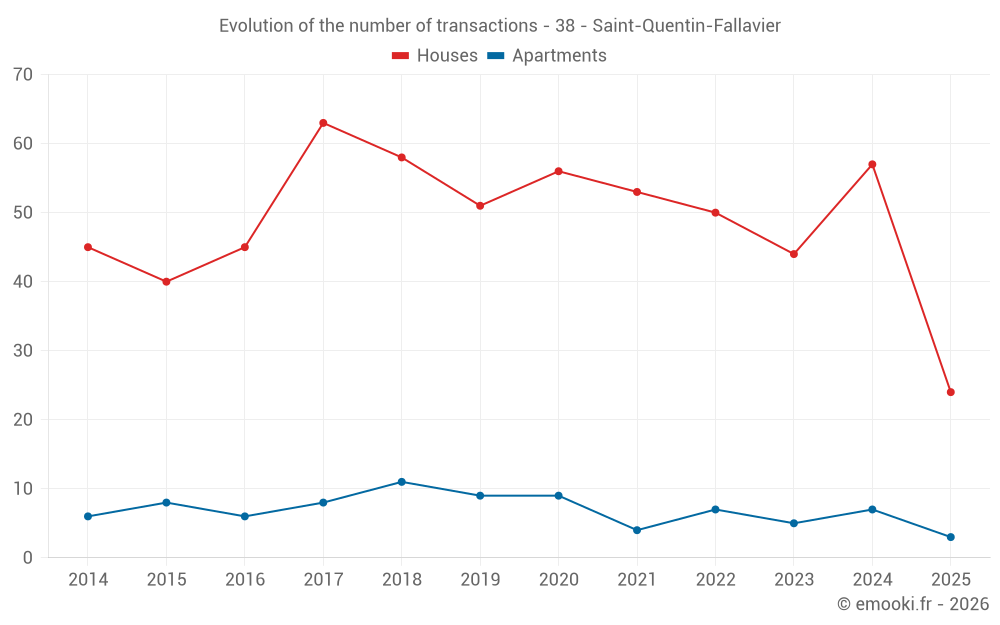
Median price on the 24 transactions of the last 6 months.
from 2 221 to
3 191  /m²
60% of transactions from the 2nd to the 8th deciles.
ApartmentsApartments
2 947  /m²
1-23-45-67-89-10
Reliability 6/10
Median price on the 17 transactions of the last 36 months.
from 2 393 to
3 126  /m²
60% of transactions from the 2nd to the 8th deciles.
DwellingsDwellings
2 624  /m²
1-23-45-67-89-10
Reliability 9/10
Median price on the 27 transactions of the last 6 months.
from 2 220 to
3 194  /m²
60% of transactions from the 2nd to the 8th deciles.
HousesEvolution of the price per m² of houses since...
1 year
-2.9%
2 years
-9.3%
3 years
-2.3%
4 years
-0.1%
5 years
+15%
6 years
+23%
7 years
+30%
8 years
+37%
9 years
+45%
10 years
+31%
11 years
+40%
The price per m² of houses has decreased by 9.3% since 2 years, but it has increased by 45% in 9 years.

Yearly evolution

Evolution of the median price per m²

Evolution of the median price per m² - 38 - Saint-Quentin-Fallavier

Evolution of the number of transactions

Warning, last year incomplete. Projections made based on the proportions between semesters of the previous year at the departmental/national level and by type of property.

Evolution of the number of transactions - 38 - Saint-Quentin-Fallavier

Yearly data

Descending order
Year
Houses
house
transactions
Houses
house
Price per m²
Apartments
apt.
transactions
Apartments
apt.
Price per m²
2025
24
2 653 
3
2 543 
2024
57
2 731 
7
2 947 
2023
44
2 924 
5
2 536 
2022
50
2 716 
7
2 933 
2021
53
2 656 
4
2 939 
2020
56
2 308 
9
2 499 
2019
51
2 151 
9
2 625 
2018
58
2 038 
11
2 083 
2017
63
1 935 
8
2 548 
2016
45
1 833 
6
2 354 
2015
40
2 024 
8
1 525 
2014
45
1 893 
6
2 350 

Analysis

Structure of prices per m²

Values of price percentiles per m² over the periods used for the estimated price of each type of property.

Structure of transaction amounts

Values of transaction amounts percentiles over the periods used for the estimated price of each type of property.

Transaction amounts and prices per m² by percentile

Ascending order
Percentile
Houses
house
Price per m²
Houses
house
Transaction amount
Apartments
apt.
Price per m²
Apartments
apt.
Transaction amount
10th percentile
1 972 
172 K
2 292 
141 K
20th percentile
2 221 
205 K
2 393 
161 K
30th percentile
2 351 
226 K
2 542 
166 K
40th percentile
2 464 
247 K
2 686 
170 K
50th percentile
2 653 
262 K
2 947 
175 K
60th percentile
2 883 
287 K
2 999 
179 K
70th percentile
2 985 
301 K
3 053 
192 K
80th percentile
3 191 
312 K
3 126 
202 K
90th percentile
3 672 
357 K
3 286 
242 K

National and departmental comparison

Evolution of the median price per m² of houses

Evolution of the median price per m² of apartments

Quarterly evolution

Evolution of the median price per m²

Evolution of the number of transactions

Quarterly data

Descending order
Quarter
Houses
house
transactions
Houses
house
Price per m²
Apartments
apt.
transactions
Apartments
apt.
Price per m²
2025 Q2
11
2 593 
1
2 543 
2025 Q1
13
2 826 
2
2 898 
2024 Q4
23
2 805 
0
--- 
2024 Q3
18
2 572 
4
2 913 
2024 Q2
6
2 839 
1
2 571 
2024 Q1
10
2 795 
2
3 042 
2023 Q4
14
2 645 
1
3 076 
2023 Q3
5
3 423 
1
2 345 
2023 Q2
13
3 011 
1
2 536 
2023 Q1
12
3 036 
2
2 810 
2022 Q4
8
2 388 
1
3 019 
2022 Q3
19
3 027 
1
3 320 
2022 Q2
11
2 632 
1
2 933 
2022 Q1
12
2 570 
4
2 370 
2021 Q4
11
2 876 
2
3 351 
2021 Q3
15
2 770 
1
2 614 
2021 Q2
14
2 494 
0
--- 
2021 Q1
13
2 278 
1
2 574 
2020 Q4
23
2 524 
5
2 807 
2020 Q3
9
2 255 
0
--- 
2020 Q2
16
2 270 
3
2 265 
2020 Q1
8
2 078 
1
2 313 
2019 Q4
8
2 012 
2
2 358 
2019 Q3
22
2 268 
2
2 848 
2019 Q2
11
2 075 
3
2 712 
2019 Q1
10
2 096 
2
2 266 
2018 Q4
17
1 972 
1
2 312 
2018 Q3
12
2 102 
3
1 748 
2018 Q2
16
2 152 
2
2 297 
2018 Q1
13
2 110 
5
2 055 
2017 Q4
18
1 972 
2
2 026 
2017 Q3
15
1 935 
2
2 196 
2017 Q2
20
1 984 
4
2 740 
2017 Q1
10
1 835 
0
--- 
2016 Q4
13
1 833 
0
--- 
2016 Q3
11
1 925 
2
2 040 
2016 Q2
10
1 576 
2
2 293 
2016 Q1
11
1 941 
2
2 570 
2015 Q4
16
2 098 
1
44 
2015 Q3
8
1 942 
2
2 103 
2015 Q2
7
1 907 
2
369 
2015 Q1
9
2 101 
3
1 789 
2014 Q4
9
1 982 
0
--- 
2014 Q3
15
1 922 
4
1 952 
2014 Q2
14
1 888 
1
2 702 
2014 Q1
7
1 777 
1
3 019 

Overview of the latest real estate transactions

The following list is an anonymized overview of the latest transactions. For more details and to find all transactions, please use the map to view transactions by plot or the transaction search page for a search by criteria.

2025-05-27
244 000 
2 624  /m²(93 m²)
Sale
Houses
House
5 rooms
93 m2
Land
101 m2
-Sols
Land
45 m2
-Sols
2025-05-19
325 000 
3 916  /m²(83 m²)
Sale
Houses
House
3 rooms
83 m2
1 outbuilding
Land
985 m2
-Sols
2025-05-16
167 000 
2 386  /m²(70 m²)
Sale
Houses
House
3 rooms
70 m2
Land
82 m2
-Sols
2025-05-13
168 000 
2 897  /m²(58 m²)
Sale
Houses
House
2 rooms
58 m2
Land
167 m2
-Sols
Land
78 m2
-Jardins
2025-05-12
301 000 
2 315  /m²(130 m²)
Sale
Houses
House
5 rooms
130 m2
Land
800 m2
-Sols
Land
5 m2
-Sols
2025-04-29
1 182 140 
497  /m²(2377 m²)
Sale
Commercial property
2377 m2
Land
6400 m2
-Sols
Land
1314 m2
-Prés
2025-04-25
276 270 
3 070  /m²(90 m²)
Sale
Houses
House
4 rooms
90 m2
Land
502 m2
-Sols
Land
204 m2
-Sols
2025-04-18
300 000 
2 222  /m²(135 m²)
Sale
Houses
House
6 rooms
135 m2
Land
608 m2
-Terrains d'agrément
Land
555 m2
-Sols
2025-04-18
219 000 
2 355  /m²(93 m²)
Sale
Houses
House
5 rooms
93 m2
2025-04-11
640 000 
1 036  /m²(618 m²)
Sale
Commercial property
323 m2
Commercial property
45 m2
Commercial property
126 m2
Commercial property
67 m2
Commercial property
57 m2
2025-04-11
223 000 
2 593  /m²(86 m²)
Sale
Houses
House
4 rooms
86 m2
Land
382 m2
-Sols
2025-04-11
178 000 
2 543  /m²(70 m²)
Sale
Apartments
Apartment
3 rooms
70 m2
2025-04-09
303 600 
3 196  /m²(95 m²)
Sale
Houses
House
4 rooms
95 m2
1 outbuilding
Land
606 m2
-Sols
Land
1283 m2
-Jardins
2025-04-03
171 000 
648  /m²(264 m²)
Sale
Commercial property
264 m2
2025-04-01
184 000 
1 704  /m²(108 m²)
Sale
Houses
House
6 rooms
108 m2
2025-03-27
99 000 
1 179  /m²(84 m²)
Sale
Houses
House
4 rooms
84 m2
Land
173 m2
-Sols
2025-03-21
371 050 
3 825  /m²(97 m²)
Sale
Houses
House
4 rooms
97 m2
Land
1030 m2
-Sols
Land
134 m2
-Sols
2025-03-14
115 000 
2 212  /m²(52 m²)
Sale
Apartments
Apartment
2 rooms
52 m2
1 outbuilding
2025-03-12
180 000 
1 935  /m²(93 m²)
Sale
Houses
House
5 rooms
93 m2
2025-02-24
255 000 
3 188  /m²(80 m²)
Sale
Houses
House
5 rooms
80 m2
Land
780 m2
-Sols
1132 transactions listed in the municipality

Isère (38)

Most expensive cities

City
name
Descending orderHouses
house
Price per m²
8 262 
4 917 
4 777 
4 663 
4 610 
4 575 
4 506 
City
name
Descending orderApartments
apt.
Price per m²
7 647 
6 370 
5 636 
4 866 
4 524 
4 492 
4 249 
4 234 
3 958 

Least expensive cities

City
name
Ascending orderHouses
house
Price per m²
502 
722 
975 
1 133 
1 198 
1 237 
City
name
Ascending orderApartments
apt.
Price per m²
475 
483 
541 
562