emooki
HomePrice mapTransactions
🇬🇧 English🇫🇷 Français🇩🇪 Deutsch🇪🇸 Español🇮🇹 Italiano

Real estate price map


Real estate price map in the municipality of Saint-André-le-Gaz.

Isère (38)
Saint-André-le-Gaz

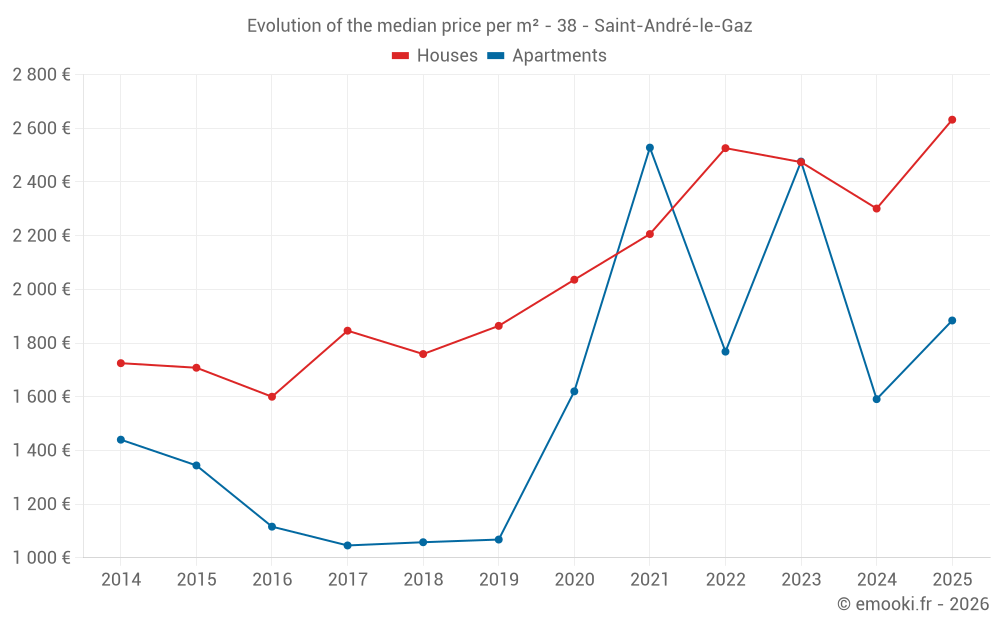
Median price of real estate
in the municipality of Saint-André-le-Gaz

HousesHouses
2 432  /m²
1-23-45-67-89-10
Reliability 8/10
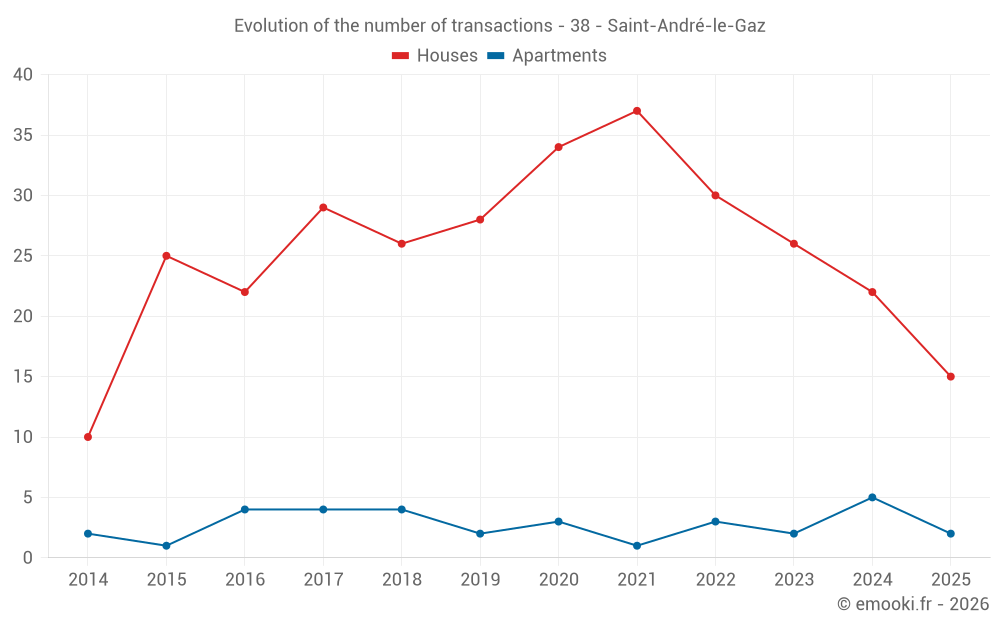
Median price on the 29 transactions of the last 12 months.
from 1 964 to
2 877  /m²
60% of transactions from the 2nd to the 8th deciles.
ApartmentsApartments
1 768  /m²
1-23-45-67-89-10
Reliability 5/10
Median price on the 13 transactions of the last 48 months.
from 1 595 to
2 201  /m²
60% of transactions from the 2nd to the 8th deciles.
DwellingsDwellings
2 301  /m²
1-23-45-67-89-10
Reliability 8/10
Median price on the 34 transactions of the last 12 months.
from 1 887 to
2 830  /m²
60% of transactions from the 2nd to the 8th deciles.
HousesEvolution of the price per m² of houses since...
1 year
+14%
2 years
+6.4%
3 years
+4.2%
4 years
+19%
5 years
+29%
6 years
+41%
7 years
+50%
8 years
+43%
9 years
+65%
10 years
+54%
11 years
+53%
ApartmentsEvolution of the price per m² of apartments since...
1 year
--
2 years
--
3 years
--
4 years
--
5 years
--
6 years
--
7 years
--
8 years
--
9 years
--
10 years
--
11 years
--

Yearly evolution

Evolution of the median price per m²

Evolution of the number of transactions

Warning, last year incomplete. Projections made based on the proportions between semesters of the previous year at the departmental/national level and by type of property.

Yearly data

Descending order
Year
Houses
house
transactions
Houses
house
Price per m²
Apartments
apt.
transactions
Apartments
apt.
Price per m²
2025
15
2 632 
2
1 884 
2024
22
2 301 
5
1 591 
2023
26
2 474 
2
2 476 
2022
30
2 526 
3
1 768 
2021
37
2 206 
1
2 528 
2020
34
2 036 
3
1 620 
2019
28
1 864 
2
1 068 
2018
26
1 759 
4
1 058 
2017
29
1 846 
4
1 046 
2016
22
1 600 
4
1 116 
2015
25
1 708 
1
1 344 
2014
10
1 725 
2
1 440 

Analysis

Structure of prices per m²

Values of price percentiles per m² over the periods used for the estimated price of each type of property.

Structure of transaction amounts

Values of transaction amounts percentiles over the periods used for the estimated price of each type of property.

Transaction amounts and prices per m² by percentile

Ascending order
Percentile
Houses
house
Price per m²
Houses
house
Transaction amount
Apartments
apt.
Price per m²
Apartments
apt.
Transaction amount
10th percentile
1 853 
174 K
1 452 
101 K
20th percentile
1 964 
195 K
1 595 
113 K
30th percentile
2 121 
203 K
1 623 
132 K
40th percentile
2 272 
226 K
1 737 
143 K
50th percentile
2 432 
239 K
1 768 
157 K
60th percentile
2 600 
270 K
1 972 
161 K
70th percentile
2 774 
283 K
2 092 
177 K
80th percentile
2 877 
301 K
2 201 
212 K
90th percentile
3 138 
320 K
2 472 
224 K

National and departmental comparison

Evolution of the median price per m² of houses

Evolution of the median price per m² of apartments

Quarterly evolution

Evolution of the median price per m²

Evolution of the number of transactions

Quarterly data

Descending order
Quarter
Houses
house
transactions
Houses
house
Price per m²
Apartments
apt.
transactions
Apartments
apt.
Price per m²
2025 Q2
7
1 977 
1
2 130 
2025 Q1
8
2 770 
1
1 638 
2024 Q4
5
2 473 
2
1 683 
2024 Q3
9
2 143 
1
1 762 
2024 Q2
6
2 312 
0
--- 
2024 Q1
2
2 585 
2
1 320 
2023 Q4
8
2 678 
1
2 248 
2023 Q3
8
2 430 
0
--- 
2023 Q2
4
2 746 
0
--- 
2023 Q1
6
2 274 
1
2 705 
2022 Q4
4
2 608 
1
1 768 
2022 Q3
8
2 100 
0
--- 
2022 Q2
10
2 611 
2
1 833 
2022 Q1
8
2 666 
0
--- 
2021 Q4
11
2 697 
1
2 528 
2021 Q3
12
2 263 
0
--- 
2021 Q2
8
2 297 
0
--- 
2021 Q1
6
1 950 
0
--- 
2020 Q4
11
1 985 
1
1 346 
2020 Q3
8
1 920 
0
--- 
2020 Q2
9
2 031 
1
1 695 
2020 Q1
6
2 300 
1
1 620 
2019 Q4
7
1 765 
1
1 688 
2019 Q3
9
1 943 
0
--- 
2019 Q2
6
2 404 
1
448 
2019 Q1
6
1 827 
0
--- 
2018 Q4
6
1 769 
0
--- 
2018 Q3
7
1 734 
1
1 040 
2018 Q2
4
1 956 
3
1 076 
2018 Q1
9
1 536 
0
--- 
2017 Q4
7
2 084 
3
942 
2017 Q3
7
1 605 
1
1 150 
2017 Q2
8
2 088 
0
--- 
2017 Q1
7
1 800 
0
--- 
2016 Q4
4
944 
0
--- 
2016 Q3
7
1 837 
3
974 
2016 Q2
5
1 601 
1
1 258 
2016 Q1
6
1 404 
0
--- 
2015 Q4
10
1 360 
0
--- 
2015 Q3
8
1 673 
0
--- 
2015 Q2
4
2 062 
1
1 344 
2015 Q1
3
1 344 
0
--- 
2014 Q4
3
1 876 
1
1 552 
2014 Q3
2
897 
0
--- 
2014 Q2
4
1 402 
1
1 328 
2014 Q1
1
2 500 
0
--- 

Isère (38)

Most expensive cities

City
name
Descending orderHouses
house
Price per m²
8 262 
4 917 
4 777 
4 663 
4 610 
4 575 
4 506 
City
name
Descending orderApartments
apt.
Price per m²
7 647 
6 370 
5 636 
4 866 
4 524 
4 492 
4 249 
4 234 
3 958 

Least expensive cities

City
name
Ascending orderHouses
house
Price per m²
502 
722 
975 
1 133 
1 198 
1 237 
City
name
Ascending orderApartments
apt.
Price per m²
475 
483 
541 
562