emooki
HomePrice mapTransactions
🇬🇧 English🇫🇷 Français🇩🇪 Deutsch🇪🇸 Español🇮🇹 Italiano

Real estate price map


Real estate price map in the municipality of Sablons, choose a section to see transactions by parcel.

Isère (38)

Sablons - Real estate price m²

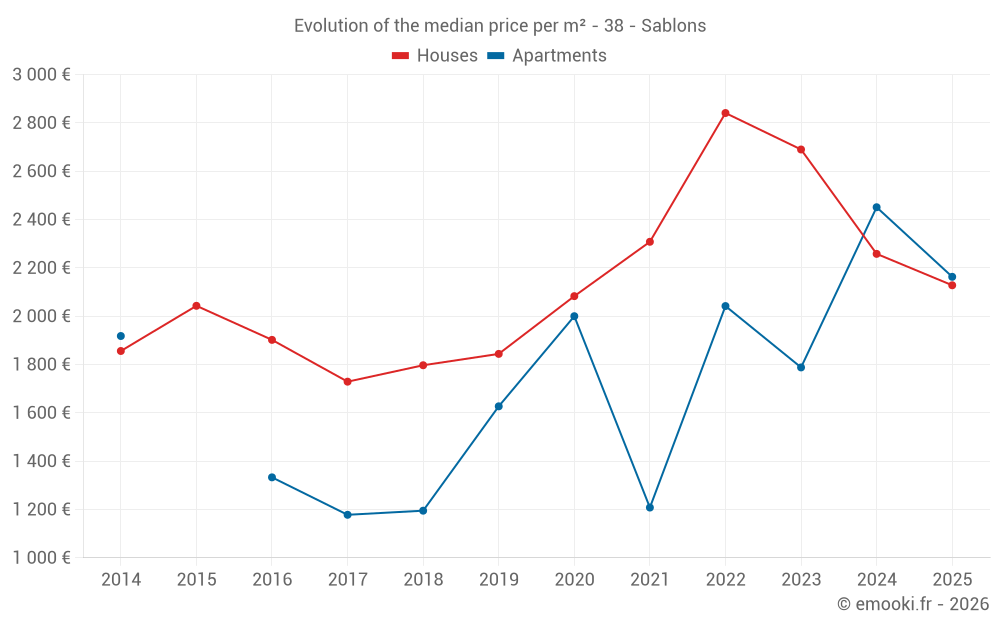
Median price of real estate
in the municipality of Sablons

HousesHouses
2 279  /m²
1-23-45-67-89-10
Reliability 8/10
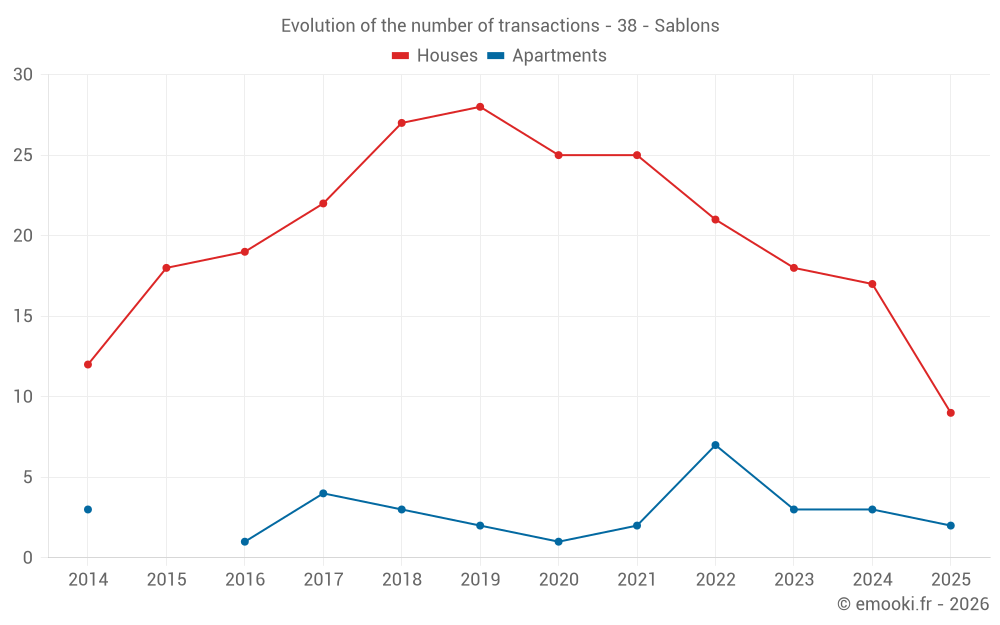
Median price on the 18 transactions of the last 12 months.
from 1 874 to
2 666  /m²
60% of transactions from the 2nd to the 8th deciles.
ApartmentsApartments
2 008  /m²
1-23-45-67-89-10
Reliability 5/10
Median price on the 16 transactions of the last 48 months.
from 1 569 to
2 451  /m²
60% of transactions from the 2nd to the 8th deciles.
DwellingsDwellings
2 329  /m²
1-23-45-67-89-10
Reliability 8/10
Median price on the 21 transactions of the last 12 months.
from 1 842 to
2 704  /m²
60% of transactions from the 2nd to the 8th deciles.
HousesEvolution of the price per m² of houses since...
1 year
-5.8%
2 years
-21%
3 years
-25%
4 years
-7.8%
5 years
+2.2%
6 years
+15%
7 years
+18%
8 years
+23%
9 years
+12%
10 years
+4.2%
11 years
+15%
The price per m² of houses has decreased by 25% since 3 years, but it has increased by 23% in 8 years.

Yearly evolution

Evolution of the median price per m²

Evolution of the median price per m² - 38 - Sablons

Evolution of the number of transactions

Warning, last year incomplete. Projections made based on the proportions between semesters of the previous year at the departmental/national level and by type of property.

Evolution of the number of transactions - 38 - Sablons

Yearly data

Descending order
Year
Houses
house
transactions
Houses
house
Price per m²
Apartments
apt.
transactions
Apartments
apt.
Price per m²
2025
9
2 128 
2
2 163 
2024
17
2 258 
3
2 451 
2023
18
2 690 
3
1 788 
2022
21
2 841 
7
2 042 
2021
25
2 308 
2
1 208 
2020
25
2 083 
1
2 000 
2019
28
1 844 
2
1 627 
2018
27
1 797 
3
1 195 
2017
22
1 729 
4
1 178 
2016
19
1 902 
1
1 333 
2015
18
2 043 
0
--- 
2014
12
1 856 
3
1 918 

Analysis

Structure of prices per m²

Values of price percentiles per m² over the periods used for the estimated price of each type of property.

Structure of transaction amounts

Values of transaction amounts percentiles over the periods used for the estimated price of each type of property.

Transaction amounts and prices per m² by percentile

Ascending order
Percentile
Houses
house
Price per m²
Houses
house
Transaction amount
Apartments
apt.
Price per m²
Apartments
apt.
Transaction amount
10th percentile
1 470 
102 K
1 234 
77 500 
20th percentile
1 874 
141 K
1 569 
89 650 
30th percentile
1 957 
164 K
1 612 
103 K
40th percentile
2 120 
173 K
1 788 
115 K
50th percentile
2 279 
207 K
2 008 
143 K
60th percentile
2 417 
221 K
2 140 
173 K
70th percentile
2 551 
236 K
2 300 
177 K
80th percentile
2 666 
242 K
2 451 
192 K
90th percentile
2 871 
285 K
2 602 
220 K

National and departmental comparison

Evolution of the median price per m² of houses

Evolution of the median price per m² of apartments

Quarterly evolution

Evolution of the median price per m²

Evolution of the number of transactions

Quarterly data

Descending order
Quarter
Houses
house
transactions
Houses
house
Price per m²
Apartments
apt.
transactions
Apartments
apt.
Price per m²
2025 Q2
6
2 417 
1
1 622 
2025 Q1
3
2 088 
1
2 704 
2024 Q4
5
2 388 
0
--- 
2024 Q3
4
2 279 
1
2 500 
2024 Q2
6
2 042 
1
2 451 
2024 Q1
2
2 687 
1
316 
2023 Q4
5
2 588 
0
--- 
2023 Q3
5
2 633 
1
1 176 
2023 Q2
5
2 910 
2
2 307 
2023 Q1
3
2 976 
0
--- 
2022 Q4
3
2 857 
0
--- 
2022 Q3
7
2 778 
3
2 042 
2022 Q2
7
3 058 
2
1 854 
2022 Q1
4
2 632 
2
1 748 
2021 Q4
12
2 363 
0
--- 
2021 Q3
6
2 202 
1
1 601 
2021 Q2
2
2 482 
0
--- 
2021 Q1
5
2 168 
1
816 
2020 Q4
10
1 996 
1
2 000 
2020 Q3
9
2 244 
0
--- 
2020 Q2
2
1 509 
0
--- 
2020 Q1
4
2 058 
0
--- 
2019 Q4
7
2 143 
0
--- 
2019 Q3
7
1 459 
0
--- 
2019 Q2
4
1 338 
1
1 444 
2019 Q1
10
2 124 
1
1 810 
2018 Q4
8
1 716 
0
--- 
2018 Q3
7
2 052 
0
--- 
2018 Q2
5
2 171 
2
1 139 
2018 Q1
7
1 708 
1
1 333 
2017 Q4
4
1 716 
0
--- 
2017 Q3
5
1 867 
4
1 178 
2017 Q2
4
1 729 
0
--- 
2017 Q1
9
1 667 
0
--- 
2016 Q4
3
1 813 
0
--- 
2016 Q3
11
1 905 
1
1 333 
2016 Q2
3
2 068 
0
--- 
2016 Q1
2
1 284 
0
--- 
2015 Q4
3
1 901 
0
--- 
2015 Q3
7
2 053 
0
--- 
2015 Q2
3
2 197 
0
--- 
2015 Q1
5
1 979 
0
--- 
2014 Q4
2
1 654 
0
--- 
2014 Q3
2
2 102 
0
--- 
2014 Q2
8
1 889 
0
--- 
2014 Q1
0
--- 
3
1 918 

Overview of the latest real estate transactions

The following list is an anonymized overview of the latest transactions. For more details and to find all transactions, please use the map to view transactions by plot or the transaction search page for a search by criteria.

2025-06-30
171 500 
2 858  /m²(60 m²)
Sale
Houses
House
2 rooms
60 m2
Land
257 m2
-Sols
2025-06-03
5 000 
Sale
Land
113 m2
-Sols
Land
137 m2
-Sols
Land
180 m2
-Sols
Land
178 m2
-Sols
2025-05-13
243 500 
2 706  /m²(90 m²)
Sale
Houses
House
4 rooms
90 m2
1 outbuilding
Land
600 m2
-Sols
2025-04-30
6 000 
Sale
Land
2294 m2
-Peupleraies
2025-04-29
235 000 
2 901  /m²(81 m²)
Sale
Houses
House
5 rooms
81 m2
Land
1030 m2
-Sols
2025-04-28
173 000 
1 922  /m²(90 m²)
Sale
Houses
House
3 rooms
90 m2
Land
243 m2
-Sols
2025-04-28
115 180 
1 622  /m²(71 m²)
Sale
Apartments
Apartment
4 rooms
71 m2
2 outbuildings
2025-04-25
236 626 
1 547  /m²(153 m²)
Sale
Houses
House
6 rooms
153 m2
1 outbuilding
Land
1446 m2
-Sols
2025-04-10
171 700 
Sale
Land
95 m2
-Sols
2025-04-04
306 420 
2 128  /m²(144 m²)
Sale
Houses
House
6 rooms
144 m2
Land
511 m2
-Sols
Land
7 m2
-Sols
Land
184 m2
-Sols
Land
20 m2
-Sols
Land
11 m2
-Sols
Land
105 m2
-Sols
Land
287 m2
-Sols
2025-03-12
58 000 
Sale
Land
450 m2
-Sols
2025-02-28
192 000 
2 704  /m²(71 m²)
Sale
Apartments
Apartment
3 rooms
71 m2
2 outbuildings
2025-02-28
25 000 
Sale
Land
4720 m2
-Vergers
Land
3610 m2
-Terres
Land
3260 m2
-Terres
Land
7630 m2
-Terres
Land
3960 m2
-Terres
Land
5350 m2
-Terres
Land
1880 m2
-Terres
Land
6040 m2
-Terres
Land
8300 m2
-Vergers
2025-02-14
85 000 
Sale
Land
267 m2
-Terrains à bâtir
Land
132 m2
-Terrains à bâtir
Land
17 m2
-Sols
Land
2 m2
-Sols
Land
10 m2
-Sols
2025-02-06
115 000 
3 108  /m²(37 m²)
Sale
Houses
House
2 rooms
37 m2
Land
850 m2
-Sols
2025-02-05
334 000 
2 088  /m²(160 m²)
Sale
Houses
House
5 rooms
160 m2
1 outbuilding
Land
811 m2
-Sols
Land
176 m2
-Sols
2025-01-27
200 000 
1 942  /m²(103 m²)
Sale
Houses
House
5 rooms
103 m2
Land
366 m2
-Sols
2025-01-02
88 500 
Sale
Land
80 m2
-Terrains à bâtir
Land
314 m2
-Terrains à bâtir
Land
12 m2
-Sols
Land
45 m2
-Sols
Land
8 m2
-Sols
2024-12-24
129 000 
1 290  /m²(100 m²)
Sale
Houses
House
5 rooms
100 m2
Land
263 m2
-Sols
2024-12-09
85 000 
Sale
Land
425 m2
-Terrains à bâtir
510 transactions listed in the municipality

Isère (38)

Most expensive cities

City
name
Descending orderHouses
house
Price per m²
8 262 
4 917 
4 777 
4 663 
4 610 
4 575 
4 506 
City
name
Descending orderApartments
apt.
Price per m²
7 647 
6 370 
5 636 
4 866 
4 524 
4 492 
4 249 
4 234 
3 958 

Least expensive cities

City
name
Ascending orderHouses
house
Price per m²
502 
722 
975 
1 133 
1 198 
1 237 
City
name
Ascending orderApartments
apt.
Price per m²
475 
483 
541 
562