emooki
HomePrice mapTransactions
🇬🇧 English🇫🇷 Français🇩🇪 Deutsch🇪🇸 Español🇮🇹 Italiano

Real estate price map


Real estate price map in the municipality of Le Pont-de-Beauvoisin, choose a section to see transactions by parcel.

Isère (38)
Le Pont-de-Beauvoisin

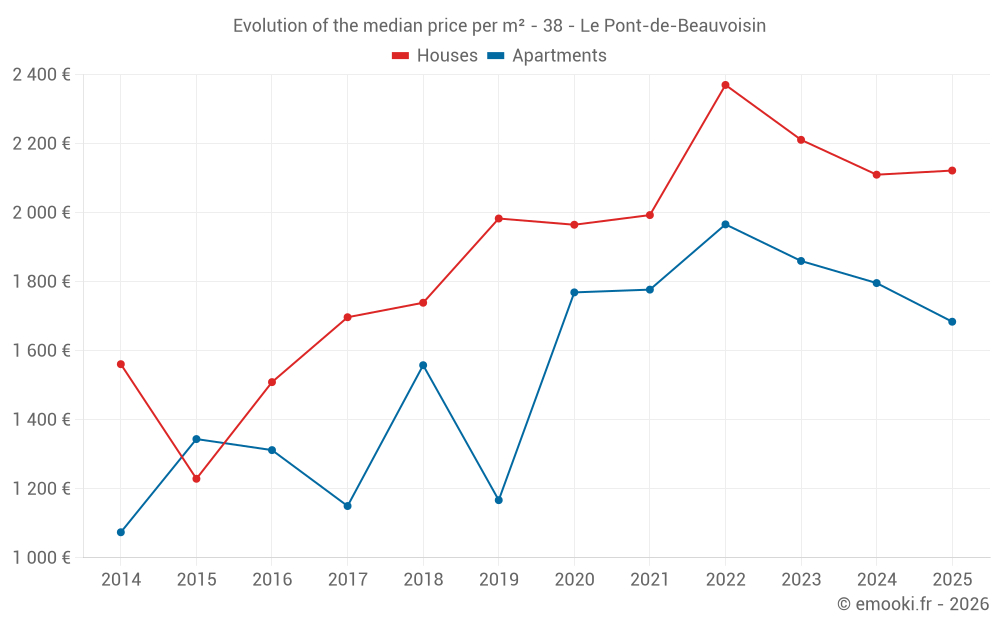
Median price of real estate
in the municipality of Le Pont-de-Beauvoisin

HousesHouses
2 189 € /m²
1-23-45-67-89-10
Reliability 8/10
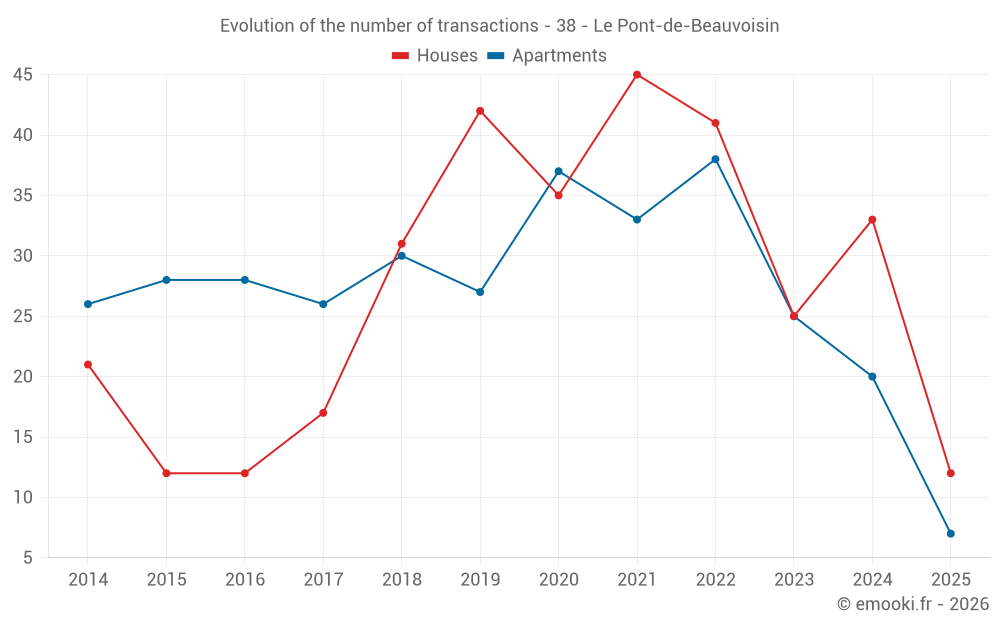
Median price on the 29 transactions of the last 12 months.
from 1 960 to
2 883 € /m²
60% of transactions from the 2nd to the 8th deciles.
ApartmentsApartments
1 684 € /m²
1-23-45-67-89-10
Reliability 8/10
Median price on the 19 transactions of the last 12 months.
from 1 284 to
2 443 € /m²
60% of transactions from the 2nd to the 8th deciles.
DwellingsDwellings
2 115 € /m²
1-23-45-67-89-10
Reliability 9/10
Median price on the 19 transactions of the last 6 months.
from 1 566 to
2 579 € /m²
60% of transactions from the 2nd to the 8th deciles.
HousesEvolution of the price per m² of houses since...
1 year
+0.6%
2 years
-4%
3 years
-10%
4 years
+6.5%
5 years
+8%
6 years
+7%
7 years
+22%
8 years
+25%
9 years
+41%
10 years
+73%
11 years
+36%
The price per m² of houses has decreased by 10% since 3 years, but it has increased by 73% in 10 years.
ApartmentsEvolution of the price per m² of apartments since...
1 year
-6.2%
2 years
-9.5%
3 years
-14%
4 years
-5.2%
5 years
-4.8%
6 years
+44%
7 years
+8.1%
8 years
+46%
9 years
+28%
10 years
+25%
11 years
+57%
The price per m² of apartments has decreased by 14% since 3 years, but it has increased by 57% in 11 years.

Yearly evolution

Evolution of the median price per m²

Evolution of the number of transactions

Warning, last year incomplete. Projections made based on the proportions between semesters of the previous year at the departmental/national level and by type of property.

Yearly data

Descending order
Year
Houses
house
transactions
Houses
house
Price per m²
Apartments
apt.
transactions
Apartments
apt.
Price per m²
2025
12
2 122 €
7
1 684 €
2024
33
2 110 €
20
1 796 €
2023
25
2 211 €
25
1 860 €
2022
41
2 370 €
38
1 966 €
2021
45
1 993 €
33
1 777 €
2020
35
1 965 €
37
1 769 €
2019
42
1 983 €
27
1 167 €
2018
31
1 739 €
30
1 558 €
2017
17
1 697 €
26
1 150 €
2016
12
1 509 €
28
1 312 €
2015
12
1 229 €
28
1 344 €
2014
21
1 561 €
26
1 074 €

Analysis

Structure of prices per m²

Values of price percentiles per m² over the periods used for the estimated price of each type of property.

Structure of transaction amounts

Values of transaction amounts percentiles over the periods used for the estimated price of each type of property.

Transaction amounts and prices per m² by percentile

Ascending order
Percentile
Houses
house
Price per m²
Houses
house
Transaction amount
Apartments
apt.
Price per m²
Apartments
apt.
Transaction amount
10th percentile
1 452 €
158 K€
916 €
50 000 €
20th percentile
1 960 €
172 K€
1 284 €
63 030 €
30th percentile
2 036 €
192 K€
1 327 €
67 600 €
40th percentile
2 115 €
200 K€
1 542 €
75 320 €
50th percentile
2 189 €
201 K€
1 684 €
101 K€
60th percentile
2 430 €
219 K€
1 920 €
119 K€
70th percentile
2 559 €
232 K€
2 223 €
148 K€
80th percentile
2 883 €
270 K€
2 443 €
156 K€
90th percentile
2 972 €
302 K€
2 575 €
178 K€

National and departmental comparison

Evolution of the median price per m² of houses

Evolution of the median price per m² of apartments

Quarterly evolution

Evolution of the median price per m²

Evolution of the number of transactions

Quarterly data

Descending order
Quarter
Houses
house
transactions
Houses
house
Price per m²
Apartments
apt.
transactions
Apartments
apt.
Price per m²
2025 Q2
6
2 122 €
4
1 740 €
2025 Q1
6
2 294 €
3
1 625 €
2024 Q4
9
2 577 €
3
1 951 €
2024 Q3
8
2 084 €
9
1 521 €
2024 Q2
4
2 107 €
5
1 842 €
2024 Q1
12
1 962 €
3
1 751 €
2023 Q4
6
2 392 €
6
1 860 €
2023 Q3
5
1 898 €
6
1 930 €
2023 Q2
4
1 952 €
10
1 747 €
2023 Q1
10
2 324 €
3
1 737 €
2022 Q4
8
2 070 €
11
1 558 €
2022 Q3
9
2 375 €
6
2 480 €
2022 Q2
9
2 370 €
12
1 966 €
2022 Q1
15
2 451 €
9
2 044 €
2021 Q4
10
1 942 €
5
1 300 €
2021 Q3
16
1 966 €
12
1 929 €
2021 Q2
10
2 220 €
12
1 307 €
2021 Q1
9
1 924 €
4
1 985 €
2020 Q4
10
1 528 €
13
2 042 €
2020 Q3
12
2 404 €
11
1 372 €
2020 Q2
7
1 931 €
5
1 293 €
2020 Q1
6
2 170 €
8
1 968 €
2019 Q4
4
2 170 €
5
1 130 €
2019 Q3
16
2 020 €
8
1 476 €
2019 Q2
11
1 772 €
7
1 069 €
2019 Q1
11
2 027 €
7
1 182 €
2018 Q4
7
1 764 €
4
1 394 €
2018 Q3
12
1 767 €
8
1 277 €
2018 Q2
7
1 736 €
13
1 831 €
2018 Q1
5
1 600 €
5
1 800 €
2017 Q4
7
1 186 €
6
931 €
2017 Q3
8
2 030 €
7
1 629 €
2017 Q2
2
1 367 €
8
1 060 €
2017 Q1
0
--- €
5
1 913 €
2016 Q4
3
2 274 €
6
1 358 €
2016 Q3
3
1 327 €
7
1 537 €
2016 Q2
4
1 485 €
4
1 170 €
2016 Q1
2
1 666 €
11
986 €
2015 Q4
1
1 211 €
5
1 392 €
2015 Q3
3
1 166 €
13
1 297 €
2015 Q2
3
1 197 €
6
1 276 €
2015 Q1
5
1 581 €
4
1 524 €
2014 Q4
5
1 901 €
6
1 594 €
2014 Q3
6
1 090 €
9
1 270 €
2014 Q2
3
1 561 €
7
840 €
2014 Q1
7
1 791 €
4
1 452 €

Overview of the latest real estate transactions

The following list is an anonymized overview of the latest transactions. For more details and to find all transactions, please use the map to view transactions by plot or the transaction search page for a search by criteria.

2025-05-28
210 000 €
963 € /m²(218 m²)
Sale
Houses
House
3 rooms
120 m2
Houses
House
5 rooms
98 m2
1 outbuilding
2025-05-28
158 000 €
1 975 € /m²(80 m²)
Sale
1 outbuilding
Land
105 m2
-Sols
Houses
House
3 rooms
80 m2
Land
175 m2
-Sols
Land
65 m2
-Sols
Land
93 m2
-Sols
2025-05-27
301 000 €
3 071 € /m²(98 m²)
Sale
Houses
House
4 rooms
98 m2
Land
372 m2
-Terrains d'agrément
/Parc
Land
500 m2
-Sols
2025-05-15
178 000 €
2 697 € /m²(66 m²)
Sale
Apartments
Apartment
3 rooms
66 m2
2 outbuildings
2025-05-13
247 500 €
2 115 € /m²(117 m²)
Sale
Houses
House
6 rooms
117 m2
Land
1097 m2
-Sols
Land
251 m2
-Sols
Land
355 m2
-Prés
2025-05-06
200 000 €
2 128 € /m²(94 m²)
Sale
Houses
House
4 rooms
94 m2
2025-05-05
64 000 €
1 684 € /m²(38 m²)
Sale
Apartments
Apartment
2 rooms
38 m2
2025-04-25
106 000 €
1 797 € /m²(59 m²)
Sale
Apartments
Apartment
3 rooms
59 m2
2 outbuildings
Land
72 m2
-Sols
2025-04-24
50 000 €
Sale
Land
259 m2
-Terrains à bâtir
2025-04-24
50 000 €
Sale
Land
12 m2
-Sols
Land
12 m2
-Sols
2025-04-23
80 000 €
988 € /m²(81 m²)
Sale
Apartments
Apartment
4 rooms
81 m2
2025-04-10
1 800 €
Sale
1 outbuilding
2025-04-10
234 000 €
2 889 € /m²(81 m²)
Sale
Houses
House
3 rooms
81 m2
1 outbuilding
Land
672 m2
-Sols
Land
572 m2
-Terrains d'agrément
/Parc
2025-03-31
27 000 €
771 € /m²(35 m²)
Sale
Commercial property
35 m2
1 outbuilding
2025-03-27
188 400 €
2 117 € /m²(89 m²)
Sale
Houses
House
4 rooms
89 m2
Land
237 m2
-Sols
2025-03-27
52 000 €
1 625 € /m²(32 m²)
Sale
Apartments
Apartment
1 room
32 m2
1 outbuilding
2025-03-26
7 500 €
Sale
Land
12 m2
-Sols
Land
12 m2
-Sols
2025-03-25
1 900 €
Sale
1 outbuilding
2025-03-25
1 900 €
Sale
1 outbuilding
2025-03-24
150 000 €
1 327 € /m²(113 m²)
Sale
Commercial property
113 m2
989 transactions listed in the municipality

Isère (38)

Most expensive cities

City
name
Descending orderHouses
house
Price per m²
8 262 €
5 712 €
4 917 €
4 777 €
4 676 €
4 663 €
4 610 €
4 575 €
4 516 €
4 506 €
City
name
Descending orderApartments
apt.
Price per m²
7 647 €
6 370 €
5 636 €
4 866 €
4 524 €
4 492 €
4 249 €
4 234 €
4 154 €
3 958 €

Least expensive cities

City
name
Ascending orderHouses
house
Price per m²
502 €
722 €
790 €
902 €
975 €
1 133 €
1 198 €
1 228 €
1 237 €
City
name
Ascending orderApartments
apt.
Price per m²
431 €
475 €
483 €
541 €
562 €
606 €