emooki
HomePrice mapTransactions
🇬🇧 English🇫🇷 Français🇩🇪 Deutsch🇪🇸 Español🇮🇹 Italiano

Real estate price map


Real estate price map in the municipality of La Motte-d'Aveillans, choose a section to see transactions by parcel.

Isère (38)

La Motte-d'Aveillans - Real estate price m²

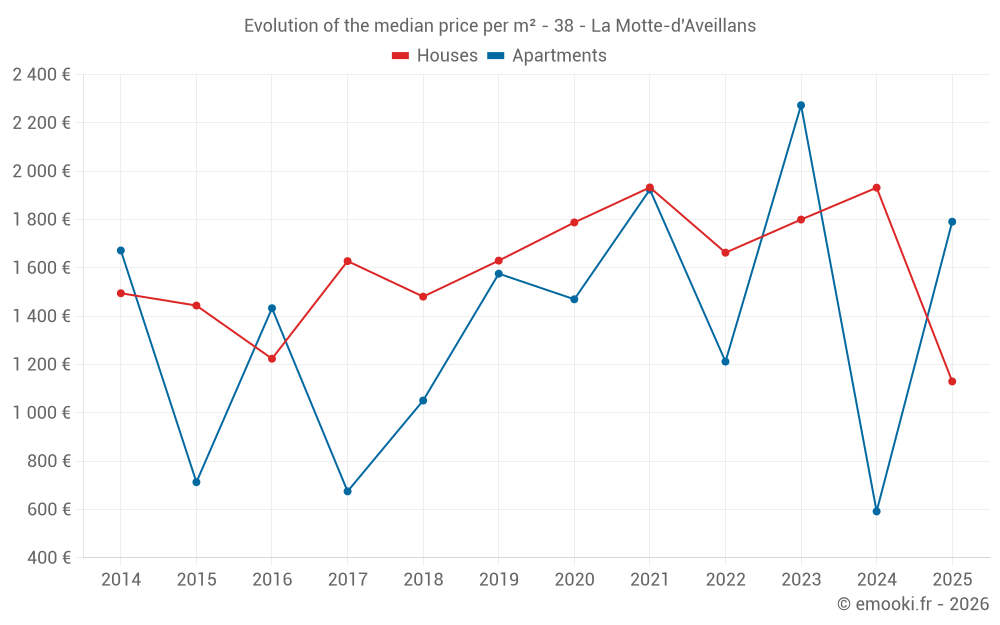
Median price of real estate
in the municipality of La Motte-d'Aveillans

HousesHouses
1 790  /m²
1-23-45-67-89-10
Reliability 8/10
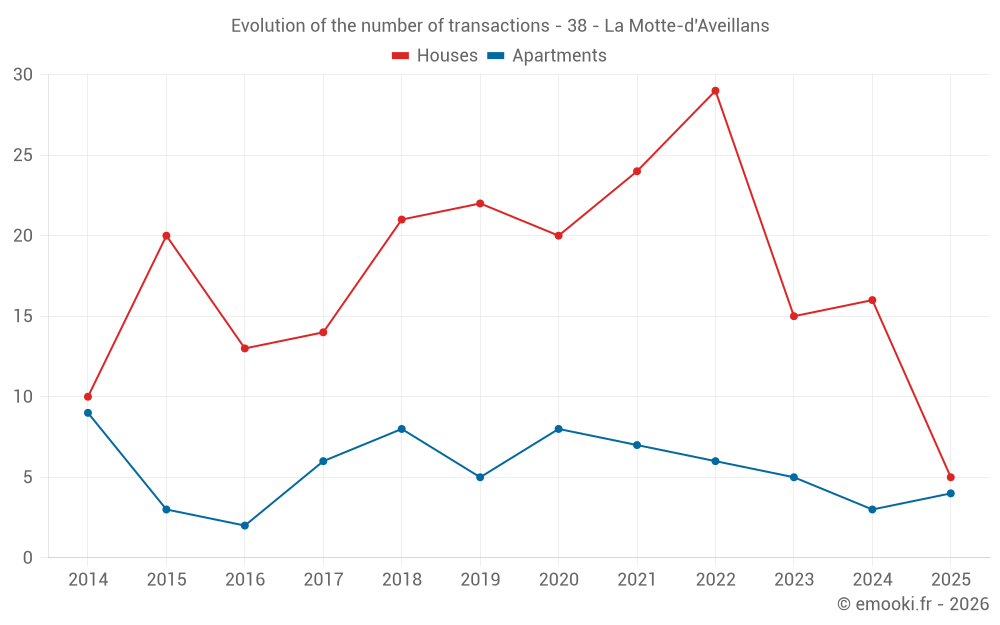
Median price on the 16 transactions of the last 12 months.
from 1 125 to
2 618  /m²
60% of transactions from the 2nd to the 8th deciles.
ApartmentsApartments
1 607  /m²
1-23-45-67-89-10
Reliability 6/10
Median price on the 15 transactions of the last 36 months.
from 847 to
2 359  /m²
60% of transactions from the 2nd to the 8th deciles.
DwellingsDwellings
1 630  /m²
1-23-45-67-89-10
Reliability 8/10
Median price on the 22 transactions of the last 12 months.
from 960 to
2 555  /m²
60% of transactions from the 2nd to the 8th deciles.
HousesEvolution of the price per m² of houses since...
1 year
-42%
2 years
-37%
3 years
-32%
4 years
-42%
5 years
-37%
6 years
-31%
7 years
-24%
8 years
-31%
9 years
-7.7%
10 years
-22%
11 years
-24%
ApartmentsEvolution of the price per m² of apartments since...
1 year
--
2 years
-21%
3 years
+48%
4 years
-6.9%
5 years
+22%
6 years
+14%
7 years
+70%
8 years
+165%
9 years
--
10 years
--
11 years
+7.1%
The price per m² of apartments has decreased by 21% since 2 years, but it has increased by 165% in 8 years.

Yearly evolution

Evolution of the median price per m²

Evolution of the median price per m² - 38 - La Motte-d'Aveillans

Evolution of the number of transactions

Warning, last year incomplete. Projections made based on the proportions between semesters of the previous year at the departmental/national level and by type of property.

Evolution of the number of transactions - 38 - La Motte-d'Aveillans

Yearly data

Descending order
Year
Houses
house
transactions
Houses
house
Price per m²
Apartments
apt.
transactions
Apartments
apt.
Price per m²
2025
5
1 130 
4
1 791 
2024
16
1 932 
3
592 
2023
15
1 800 
5
2 273 
2022
29
1 663 
6
1 212 
2021
24
1 933 
7
1 924 
2020
20
1 788 
8
1 470 
2019
22
1 630 
5
1 576 
2018
21
1 481 
8
1 051 
2017
14
1 628 
6
675 
2016
13
1 224 
2
1 433 
2015
20
1 444 
3
713 
2014
10
1 495 
9
1 672 

Analysis

Structure of prices per m²

Values of price percentiles per m² over the periods used for the estimated price of each type of property.

Structure of transaction amounts

Values of transaction amounts percentiles over the periods used for the estimated price of each type of property.

Transaction amounts and prices per m² by percentile

Ascending order
Percentile
Houses
house
Price per m²
Houses
house
Transaction amount
Apartments
apt.
Price per m²
Apartments
apt.
Transaction amount
10th percentile
1 002 
67 799 
595 
96 400 
20th percentile
1 125 
87 150 
847 
104 K
30th percentile
1 128 
107 K
1 199 
115 K
40th percentile
1 481 
126 K
1 326 
133 K
50th percentile
1 790 
141 K
1 607 
140 K
60th percentile
2 000 
160 K
1 891 
155 K
70th percentile
2 236 
178 K
2 269 
171 K
80th percentile
2 618 
220 K
2 359 
182 K
90th percentile
3 590 
250 K
2 610 
210 K

National and departmental comparison

Evolution of the median price per m² of houses

Evolution of the median price per m² of apartments

Quarterly evolution

Evolution of the median price per m²

Evolution of the number of transactions

Quarterly data

Descending order
Quarter
Houses
house
transactions
Houses
house
Price per m²
Apartments
apt.
transactions
Apartments
apt.
Price per m²
2025 Q2
2
1 465 
2
964 
2025 Q1
3
1 125 
2
2 472 
2024 Q4
8
2 085 
1
909 
2024 Q3
3
1 779 
1
592 
2024 Q2
1
2 324 
0
--- 
2024 Q1
4
1 744 
1
484 
2023 Q4
2
1 764 
0
--- 
2023 Q3
4
2 411 
1
2 642 
2023 Q2
5
2 333 
2
1 960 
2023 Q1
4
1 081 
2
1 942 
2022 Q4
12
1 710 
1
1 168 
2022 Q3
7
1 742 
2
1 958 
2022 Q2
5
1 047 
2
914 
2022 Q1
5
2 000 
1
1 173 
2021 Q4
7
2 000 
1
2 294 
2021 Q3
8
1 659 
1
2 735 
2021 Q2
5
1 767 
3
1 924 
2021 Q1
4
1 593 
2
1 385 
2020 Q4
11
1 812 
2
1 464 
2020 Q3
2
1 479 
2
1 568 
2020 Q2
5
1 763 
3
1 440 
2020 Q1
2
1 524 
1
1 714 
2019 Q4
7
2 091 
0
--- 
2019 Q3
6
1 534 
3
1 576 
2019 Q2
3
1 706 
1
1 016 
2019 Q1
6
1 078 
1
2 043 
2018 Q4
7
1 938 
1
1 583 
2018 Q3
7
1 489 
2
1 595 
2018 Q2
4
1 074 
5
909 
2018 Q1
3
756 
0
--- 
2017 Q4
4
1 454 
0
--- 
2017 Q3
1
937 
3
710 
2017 Q2
6
1 623 
1
410 
2017 Q1
3
2 361 
2
962 
2016 Q4
4
1 325 
1
1 120 
2016 Q3
1
740 
0
--- 
2016 Q2
3
1 507 
1
1 746 
2016 Q1
5
831 
0
--- 
2015 Q4
6
1 168 
1
375 
2015 Q3
6
1 550 
2
832 
2015 Q2
4
1 170 
0
--- 
2015 Q1
4
1 632 
0
--- 
2014 Q4
5
1 198 
1
808 
2014 Q3
3
1 438 
4
1 619 
2014 Q2
2
2 020 
0
--- 
2014 Q1
0
--- 
4
1 677 

Overview of the latest real estate transactions

The following list is an anonymized overview of the latest transactions. For more details and to find all transactions, please use the map to view transactions by plot or the transaction search page for a search by criteria.

2025-06-16
30 000 
600  /m²(50 m²)
Sale
Apartments
Apartment
3 rooms
50 m2
1 outbuilding
2025-06-02
3 000 
Sale
Land
1023 m2
-Prés
2025-05-14
126 000 
1 800  /m²(70 m²)
Sale
Houses
House
4 rooms
70 m2
1 outbuilding
Land
220 m2
-Sols
Land
82 m2
-Sols
Land
2 m2
-Sols
2025-04-22
130 000 
1 327  /m²(98 m²)
Sale
Apartments
Apartment
5 rooms
98 m2
1 outbuilding
Land
155 m2
-Jardins
2025-04-15
142 830 
Sale
Land
1242 m2
-Terres
2025-04-11
130 000 
1 130  /m²(115 m²)
Sale
Houses
House
4 rooms
115 m2
Land
287 m2
-Sols
2025-03-31
55 000 
932  /m²(59 m²)
Sale
Houses
House
3 rooms
59 m2
1 outbuilding
Land
330 m2
-Sols
2025-03-11
272 880 
2 255  /m²(121 m²)
Sale
Apartments
Apartment
1 room
40 m2
Apartments
Apartment
3 rooms
47 m2
Apartments
Apartment
2 rooms
34 m2
1 outbuilding
Land
303 m2
-Sols
2025-02-13
51 000 
Sale
Land
693 m2
-Terrains à bâtir
Land
31 m2
-Terrains à bâtir
2025-01-30
174 850 
2 690  /m²(65 m²)
Sale
Apartments
Apartment
3 rooms
65 m2
2 outbuildings
2025-01-29
186 400 
2 301  /m²(81 m²)
Sale
Houses
House
4 rooms
81 m2
Land
74 m2
-Sols
Land
138 m2
-Sols
2025-01-29
18 000 
Sale
Land
355 m2
-Landes
/Friche
Land
999 m2
-Prés
2025-01-24
90 000 
1 125  /m²(80 m²)
Sale
Houses
House
4 rooms
80 m2
Land
93 m2
-Sols
1 outbuilding
Land
77 m2
-Sols
Land
34 m2
-Sols
Land
112 m2
-Jardins
Land
35 m2
-Jardins
2024-12-30
80 598 
4 030  /m²(20 m²)
Sale
Houses
House
1 room
20 m2
Land
279 m2
-Sols
Land
10 m2
-Sols
2024-12-27
230 000 
2 170  /m²(106 m²)
Sale
Houses
House
4 rooms
106 m2
Land
607 m2
-Sols
2024-12-18
87 150 
764  /m²(114 m²)
Sale
Houses
House
4 rooms
114 m2
Land
60 m2
-Sols
Land
8 m2
-Sols
Land
244 m2
-Jardins
Land
165 m2
-Sols
Land
122 m2
-Sols
Land
175 m2
-Jardins
Land
216 m2
-Sols
2024-12-16
100 000 
909  /m²(110 m²)
Sale
Apartments
Apartment
1 room
40 m2
Apartments
Apartment
1 room
70 m2
Land
113 m2
-Sols
2024-12-13
160 000 
1 481  /m²(108 m²)
Sale
Houses
House
4 rooms
108 m2
Land
500 m2
-Sols
Land
287 m2
-Terres
Land
278 m2
-Terres
Land
601 m2
-Jardins
Land
5 m2
-Sols
2024-12-06
270 000 
2 000  /m²(135 m²)
Sale
1 outbuilding
Land
155 m2
-Sols
Houses
House
4 rooms
135 m2
Land
93 m2
-Sols
1 outbuilding
Land
495 m2
-Jardins
Land
200 m2
-Sols
Land
58 m2
-Sols
2024-11-26
8 500 
Sale
Land
269 m2
-Sols
1 outbuilding
Land
17 m2
-Sols
401 transactions listed in the municipality

Isère (38)

Most expensive cities

City
name
Descending orderHouses
house
Price per m²
8 262 
4 917 
4 777 
4 663 
4 610 
4 575 
4 506 
City
name
Descending orderApartments
apt.
Price per m²
7 647 
6 370 
5 636 
4 866 
4 524 
4 492 
4 249 
4 234 
3 958 

Least expensive cities

City
name
Ascending orderHouses
house
Price per m²
502 
722 
975 
1 133 
1 198 
1 237 
City
name
Ascending orderApartments
apt.
Price per m²
475 
483 
541 
562