emooki
HomePrice mapTransactions
🇬🇧 English🇫🇷 Français🇩🇪 Deutsch🇪🇸 Español🇮🇹 Italiano

Real estate price map


Real estate price map in the municipality of Vendémian.

Hérault (34)
Vendémian

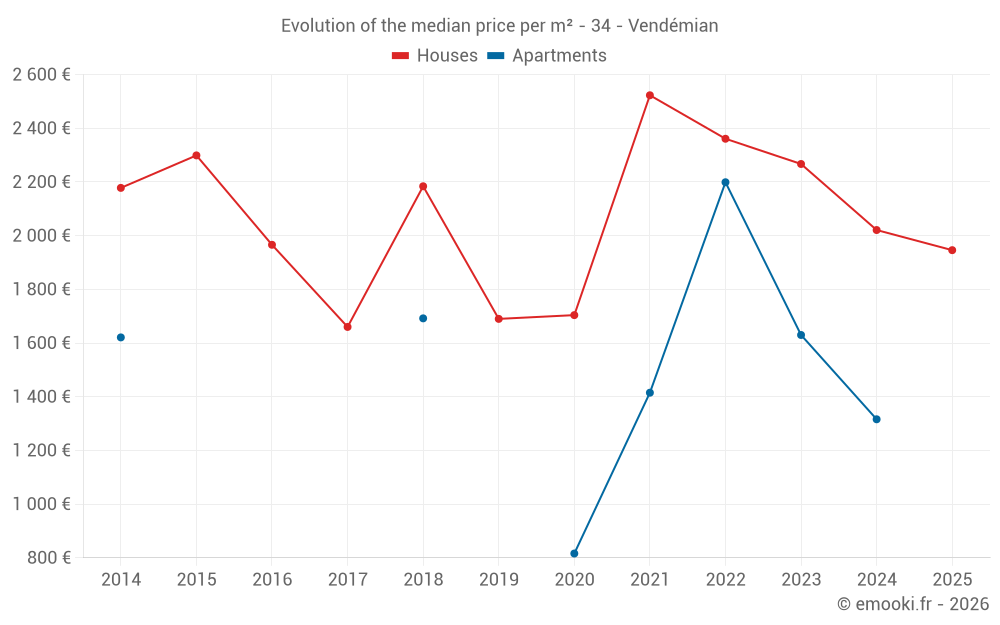
Median price of real estate
in the municipality of Vendémian

HousesHouses
2 252  /m²
1-23-45-67-89-10
Reliability 7/10
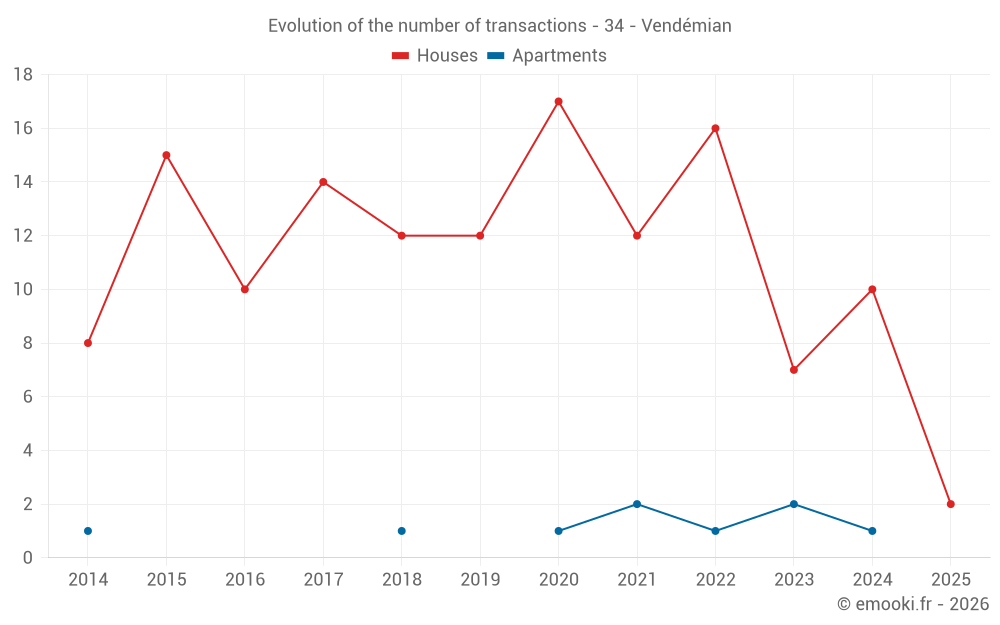
Median price on the 14 transactions of the last 24 months.
from 1 092 to
3 147  /m²
60% of transactions from the 2nd to the 8th deciles.
ApartmentsApartments
1 316  /m²
1-23-45-67-89-10
Reliability 3/10
Median price on the 7 transactions of the last 72 months.
DwellingsDwellings
2 021  /m²
1-23-45-67-89-10
Reliability 7/10
Median price on the 16 transactions of the last 24 months.
from 855 to
2 891  /m²
60% of transactions from the 2nd to the 8th deciles.
HousesEvolution of the price per m² of houses since...
1 year
--
2 years
--
3 years
--
4 years
--
5 years
--
6 years
--
7 years
--
8 years
--
9 years
--
10 years
--
11 years
--
ApartmentsEvolution of the price per m² of apartments since...
1 year
--
2 years
--
3 years
--
4 years
--
5 years
--
6 years
--
7 years
--
8 years
--
9 years
--
10 years
--
11 years
--

Yearly evolution

Evolution of the median price per m²

Evolution of the number of transactions

Warning, last year incomplete. Projections made based on the proportions between semesters of the previous year at the departmental/national level and by type of property.

Yearly data

Descending order
Year
Houses
house
transactions
Houses
house
Price per m²
Apartments
apt.
transactions
Apartments
apt.
Price per m²
2025
2
1 946 
0
--- 
2024
10
2 021 
1
1 316 
2023
7
2 267 
2
1 630 
2022
16
2 361 
1
2 199 
2021
12
2 523 
2
1 415 
2020
17
1 704 
1
816 
2019
12
1 690 
0
--- 
2018
12
2 184 
1
1 692 
2017
14
1 660 
0
--- 
2016
10
1 966 
0
--- 
2015
15
2 299 
0
--- 
2014
8
2 178 
1
1 621 

Analysis

Structure of prices per m²

Values of price percentiles per m² over the periods used for the estimated price of each type of property.

Structure of transaction amounts

Values of transaction amounts percentiles over the periods used for the estimated price of each type of property.

Transaction amounts and prices per m² by percentile

Ascending order
Percentile
Houses
house
Price per m²
Houses
house
Transaction amount
Apartments
apt.
Price per m²
Apartments
apt.
Transaction amount
10th percentile
504 
72 303 
741 
61 600 
20th percentile
1 092 
96 404 
768 
83 000 
30th percentile
1 301 
109 K
804 
92 000 
40th percentile
1 990 
175 K
1 016 
119 K
50th percentile
2 252 
209 K
1 316 
155 K
60th percentile
2 553 
229 K
1 793 
161 K
70th percentile
2 814 
291 K
2 129 
175 K
80th percentile
3 147 
312 K
2 181 
205 K
90th percentile
3 549 
405 K
2 321 
262 K

National and departmental comparison

Evolution of the median price per m² of houses

Evolution of the median price per m² of apartments

Quarterly evolution

Evolution of the median price per m²

Evolution of the number of transactions

Quarterly data

Descending order
Quarter
Houses
house
transactions
Houses
house
Price per m²
Apartments
apt.
transactions
Apartments
apt.
Price per m²
2025 Q1
2
1 946 
0
--- 
2024 Q3
4
2 848 
0
--- 
2024 Q1
6
1 610 
1
1 316 
2023 Q4
0
--- 
1
756 
2023 Q3
2
3 544 
0
--- 
2023 Q2
3
1 376 
1
2 503 
2023 Q1
2
2 003 
0
--- 
2022 Q4
2
2 339 
0
--- 
2022 Q3
5
2 547 
1
2 199 
2022 Q2
6
1 041 
0
--- 
2022 Q1
3
3 335 
0
--- 
2021 Q4
1
1 739 
1
719 
2021 Q3
6
2 668 
1
2 111 
2021 Q2
3
2 374 
0
--- 
2021 Q1
2
1 876 
0
--- 
2020 Q4
5
1 812 
0
--- 
2020 Q3
5
797 
0
--- 
2020 Q2
6
2 128 
0
--- 
2020 Q1
1
2 289 
1
816 
2019 Q4
2
1 866 
0
--- 
2019 Q3
4
1 854 
0
--- 
2019 Q2
2
2 129 
0
--- 
2019 Q1
4
1 572 
0
--- 
2018 Q4
2
2 243 
0
--- 
2018 Q3
1
2 133 
0
--- 
2018 Q2
5
2 416 
1
1 692 
2018 Q1
4
2 006 
0
--- 
2017 Q3
4
2 146 
0
--- 
2017 Q2
6
1 798 
0
--- 
2017 Q1
4
1 486 
0
--- 
2016 Q4
2
1 685 
0
--- 
2016 Q3
5
1 950 
0
--- 
2016 Q2
2
2 062 
0
--- 
2016 Q1
1
2 612 
0
--- 
2015 Q4
7
2 246 
0
--- 
2015 Q3
6
2 558 
0
--- 
2015 Q2
2
1 500 
0
--- 
2014 Q4
3
1 206 
0
--- 
2014 Q3
2
3 330 
1
1 621 
2014 Q2
2
1 890 
0
--- 
2014 Q1
1
2 133 
0
--- 

Hérault (34)

Most expensive cities

City
name
Descending orderHouses
house
Price per m²
6 604 
6 267 
4 826 
4 550 
4 500 
4 436 
4 422 
4 418 
City
name
Descending orderApartments
apt.
Price per m²
5 318 
4 953 
4 917 
4 496 
4 294 
4 214 
4 145 

Least expensive cities

City
name
Ascending orderHouses
house
Price per m²
426 
684 
848 
1 008 
City
name
Ascending orderApartments
apt.
Price per m²
267 
302 
308 
337 
338 
448 
454 
481