Median price of real estate
in the municipality of Saint-André-de-Sangonis
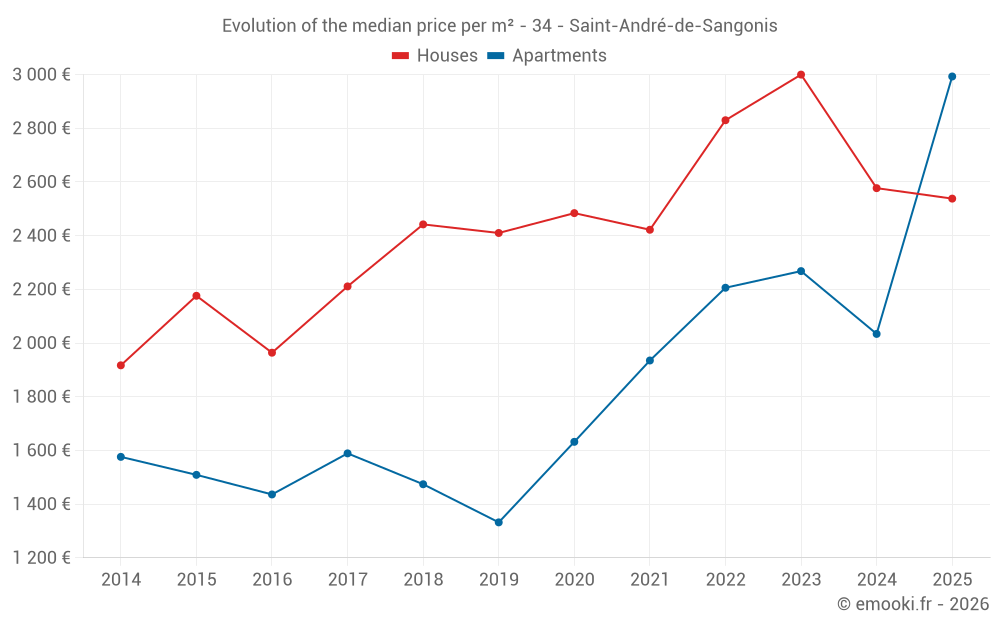
Houses
2 538 € /m²
Reliability 9/10
Median price on the 18 transactions of the last 6 months.
from 1 996 to
3 123 € /m²
3 123 € /m²
60% of transactions from the 2nd to the 8th deciles.
Apartments
2 200 € /m²
Reliability 7/10
Median price on the 20 transactions of the last 24 months.
from 1 851 to
2 573 € /m²
2 573 € /m²
60% of transactions from the 2nd to the 8th deciles.
Dwellings
2 569 € /m²
Reliability 9/10
Median price on the 19 transactions of the last 6 months.
from 2 074 to
3 115 € /m²
3 115 € /m²
60% of transactions from the 2nd to the 8th deciles.