emooki
HomePrice mapTransactions
🇬🇧 English🇫🇷 Français🇩🇪 Deutsch🇪🇸 Español🇮🇹 Italiano

Real estate price map


Real estate price map in the municipality of Jacou, choose a section to see transactions by parcel.

Hérault (34)
Jacou

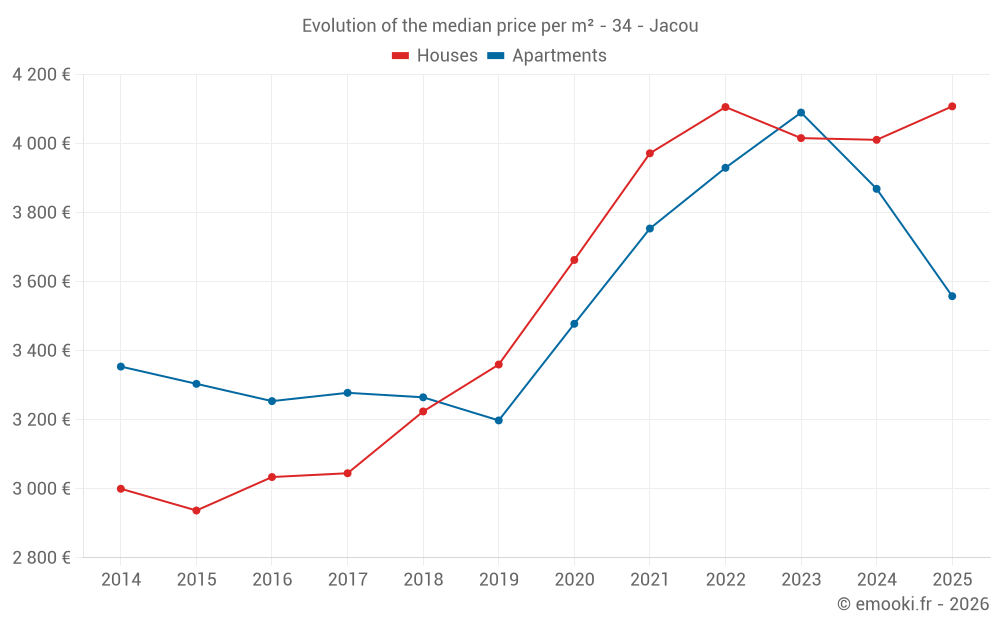
Median price of real estate
in the municipality of Jacou

HousesHouses
4 017 € /m²
1-23-45-67-89-10
Reliability 8/10
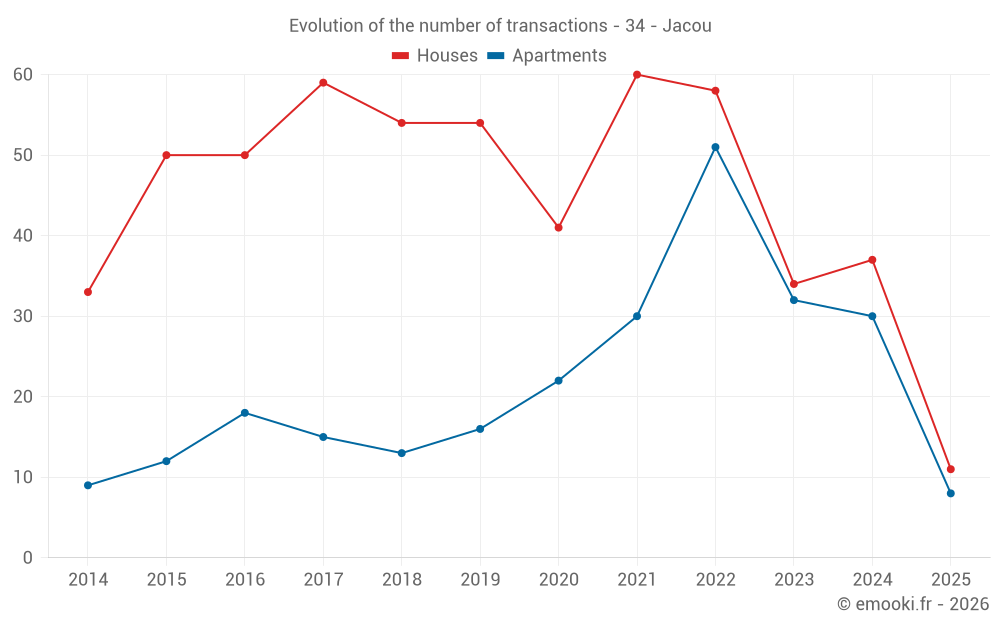
Median price on the 30 transactions of the last 12 months.
from 3 406 to
4 525 € /m²
60% of transactions from the 2nd to the 8th deciles.
ApartmentsApartments
3 757 € /m²
1-23-45-67-89-10
Reliability 8/10
Median price on the 21 transactions of the last 12 months.
from 3 327 to
4 173 € /m²
60% of transactions from the 2nd to the 8th deciles.
DwellingsDwellings
3 705 € /m²
1-23-45-67-89-10
Reliability 9/10
Median price on the 19 transactions of the last 6 months.
from 3 172 to
4 333 € /m²
60% of transactions from the 2nd to the 8th deciles.
HousesEvolution of the price per m² of houses since...
1 year
+2.4%
2 years
+2.3%
3 years
+0%
4 years
+3.4%
5 years
+12%
6 years
+22%
7 years
+27%
8 years
+35%
9 years
+35%
10 years
+40%
11 years
+37%
ApartmentsEvolution of the price per m² of apartments since...
1 year
-8%
2 years
-13%
3 years
-9.5%
4 years
-5.2%
5 years
+2.3%
6 years
+11%
7 years
+9%
8 years
+8.5%
9 years
+9.3%
10 years
+7.7%
11 years
+6.1%
The price per m² of apartments has decreased by 13% since 2 years, but it has increased by 11% in 6 years.

Yearly evolution

Evolution of the median price per m²

Evolution of the number of transactions

Warning, last year incomplete. Projections made based on the proportions between semesters of the previous year at the departmental/national level and by type of property.

Yearly data

Descending order
Year
Houses
house
transactions
Houses
house
Price per m²
Apartments
apt.
transactions
Apartments
apt.
Price per m²
2025
11
4 108 €
8
3 558 €
2024
37
4 011 €
30
3 869 €
2023
34
4 016 €
32
4 090 €
2022
58
4 106 €
51
3 930 €
2021
60
3 972 €
30
3 754 €
2020
41
3 663 €
22
3 478 €
2019
54
3 360 €
16
3 198 €
2018
54
3 224 €
13
3 265 €
2017
59
3 045 €
15
3 278 €
2016
50
3 034 €
18
3 254 €
2015
50
2 937 €
12
3 304 €
2014
33
3 000 €
9
3 354 €

Analysis

Structure of prices per m²

Values of price percentiles per m² over the periods used for the estimated price of each type of property.

Structure of transaction amounts

Values of transaction amounts percentiles over the periods used for the estimated price of each type of property.

Transaction amounts and prices per m² by percentile

Ascending order
Percentile
Houses
house
Price per m²
Houses
house
Transaction amount
Apartments
apt.
Price per m²
Apartments
apt.
Transaction amount
10th percentile
2 503 €
280 K€
2 889 €
97 000 €
20th percentile
3 406 €
312 K€
3 327 €
127 K€
30th percentile
3 781 €
350 K€
3 677 €
138 K€
40th percentile
3 961 €
356 K€
3 705 €
177 K€
50th percentile
4 017 €
366 K€
3 757 €
189 K€
60th percentile
4 204 €
399 K€
3 880 €
226 K€
70th percentile
4 392 €
421 K€
3 991 €
251 K€
80th percentile
4 525 €
491 K€
4 173 €
290 K€
90th percentile
4 699 €
537 K€
4 262 €
336 K€

National and departmental comparison

Evolution of the median price per m² of houses

Evolution of the median price per m² of apartments

Quarterly evolution

Evolution of the median price per m²

Evolution of the number of transactions

Quarterly data

Descending order
Quarter
Houses
house
transactions
Houses
house
Price per m²
Apartments
apt.
transactions
Apartments
apt.
Price per m²
2025 Q2
4
4 146 €
4
3 356 €
2025 Q1
7
3 804 €
4
3 696 €
2024 Q4
6
3 994 €
7
3 880 €
2024 Q3
13
4 023 €
6
4 129 €
2024 Q2
14
4 130 €
9
3 929 €
2024 Q1
4
3 472 €
8
3 648 €
2023 Q4
6
3 877 €
5
3 973 €
2023 Q3
8
4 495 €
12
4 114 €
2023 Q2
9
3 913 €
7
4 192 €
2023 Q1
11
3 773 €
8
3 774 €
2022 Q4
12
4 196 €
13
4 125 €
2022 Q3
22
3 984 €
15
3 862 €
2022 Q2
11
3 781 €
12
3 892 €
2022 Q1
13
4 260 €
11
3 731 €
2021 Q4
17
3 990 €
9
4 000 €
2021 Q3
19
3 978 €
8
3 844 €
2021 Q2
16
3 858 €
8
3 686 €
2021 Q1
8
4 008 €
5
3 494 €
2020 Q4
11
4 004 €
9
3 605 €
2020 Q3
8
3 634 €
3
3 488 €
2020 Q2
8
3 690 €
6
3 266 €
2020 Q1
14
3 534 €
4
3 358 €
2019 Q4
16
3 739 €
6
3 426 €
2019 Q3
17
3 255 €
5
3 213 €
2019 Q2
10
3 536 €
3
2 855 €
2019 Q1
11
3 191 €
2
2 911 €
2018 Q4
12
3 260 €
6
3 489 €
2018 Q3
22
3 036 €
2
2 926 €
2018 Q2
8
3 292 €
3
3 398 €
2018 Q1
12
3 478 €
2
2 156 €
2017 Q4
21
3 028 €
1
3 517 €
2017 Q3
17
3 218 €
5
3 141 €
2017 Q2
13
2 887 €
3
2 894 €
2017 Q1
8
2 996 €
6
3 421 €
2016 Q4
16
2 976 €
4
2 779 €
2016 Q3
17
3 019 €
2
3 412 €
2016 Q2
8
3 074 €
7
3 397 €
2016 Q1
9
3 462 €
5
3 293 €
2015 Q4
15
2 564 €
2
3 064 €
2015 Q3
12
2 871 €
4
3 798 €
2015 Q2
11
3 010 €
4
2 742 €
2015 Q1
12
3 025 €
2
2 962 €
2014 Q4
5
2 717 €
2
3 010 €
2014 Q3
10
2 974 €
3
2 904 €
2014 Q2
11
3 258 €
3
3 536 €
2014 Q1
7
2 533 €
1
3 844 €

Overview of the latest real estate transactions

The following list is an anonymized overview of the latest transactions. For more details and to find all transactions, please use the map to view transactions by plot or the transaction search page for a search by criteria.

2025-06-30
107 000 €
4 458 € /m²(24 m²)
Sale
Apartments
Apartment
1 room
24 m2
1 outbuilding
2025-06-11
185 000 €
1 989 € /m²(93 m²)
Sale
Commercial property
93 m2
2025-06-11
242 860 €
2 358 € /m²(103 m²)
Sale
Houses
House
4 rooms
103 m2
Land
460 m2
-Sols
2025-06-06
355 500 €
4 444 € /m²(80 m²)
Sale
Houses
House
4 rooms
80 m2
2 outbuildings
2025-05-27
299 900 €
4 108 € /m²(73 m²)
Sale
Houses
House
3 rooms
73 m2
Land
660 m2
-Sols
2025-05-23
138 000 €
3 286 € /m²(42 m²)
Sale
Apartments
Apartment
2 rooms
42 m2
1 outbuilding
2025-05-19
161 050 €
3 427 € /m²(47 m²)
Sale
Apartments
Apartment
2 rooms
47 m2
1 outbuilding
2025-04-29
397 500 €
4 184 € /m²(95 m²)
Sale
Houses
House
4 rooms
95 m2
Land
422 m2
-Sols
2025-04-22
130 000 €
2 889 € /m²(45 m²)
Sale
1 outbuilding
Apartments
Apartment
2 rooms
45 m2
2025-03-31
366 000 €
2 331 € /m²(157 m²)
Sale
Houses
House
6 rooms
157 m2
Land
379 m2
-Sols
Land
406 m2
-Sols
2025-03-28
226 000 €
3 705 € /m²(61 m²)
Sale
Apartments
Apartment
3 rooms
61 m2
2 outbuildings
2025-03-28
365 000 €
2 570 € /m²(142 m²)
Sale
Commercial property
142 m2
2025-02-20
250 550 €
3 855 € /m²(65 m²)
Sale
Apartments
Apartment
3 rooms
65 m2
1 outbuilding
2025-01-31
314 300 €
4 305 € /m²(73 m²)
Sale
Houses
House
3 rooms
73 m2
Land
565 m2
-Sols
2025-01-30
177 000 €
3 688 € /m²(48 m²)
Sale
Apartments
Apartment
2 rooms
48 m2
1 outbuilding
2025-01-20
524 880 €
4 374 € /m²(120 m²)
Sale
Houses
House
6 rooms
120 m2
2 outbuildings
Land
410 m2
-Sols
2025-01-16
408 050 €
4 435 € /m²(92 m²)
Sale
Houses
House
5 rooms
92 m2
Land
238 m2
-Sols
2025-01-10
350 000 €
3 804 € /m²(92 m²)
Sale
Houses
House
3 rooms
92 m2
1 outbuilding
Land
278 m2
-Sols
Land
316 m2
-Sols
2025-01-09
226 250 €
3 327 € /m²(68 m²)
Sale
Apartments
Apartment
5 rooms
68 m2
Land
85 m2
-Sols
2025-01-07
450 000 €
3 000 € /m²(150 m²)
Sale
Houses
House
5 rooms
150 m2
Land
629 m2
-Sols
1087 transactions listed in the municipality

Hérault (34)

Most expensive cities

City
name
Descending orderHouses
house
Price per m²
6 604 €
6 267 €
4 826 €
4 686 €
4 587 €
4 550 €
4 500 €
4 436 €
4 422 €
4 418 €
City
name
Descending orderApartments
apt.
Price per m²
5 318 €
5 204 €
4 953 €
4 917 €
4 496 €
4 294 €
4 238 €
4 214 €
4 145 €

Least expensive cities

City
name
Ascending orderHouses
house
Price per m²
426 €
684 €
848 €
894 €
974 €
1 006 €
1 008 €
City
name
Ascending orderApartments
apt.
Price per m²
267 €
302 €
308 €
337 €
338 €
347 €
448 €
454 €
481 €