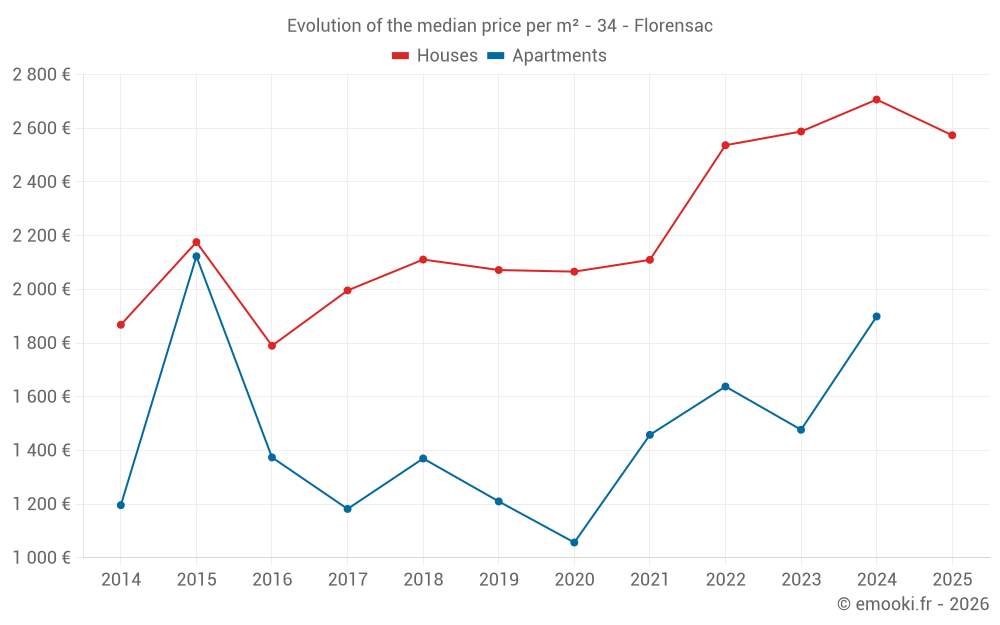
Median price of real estate
in the municipality of Florensac
Houses
2 574 € /m²
Reliability 9/10
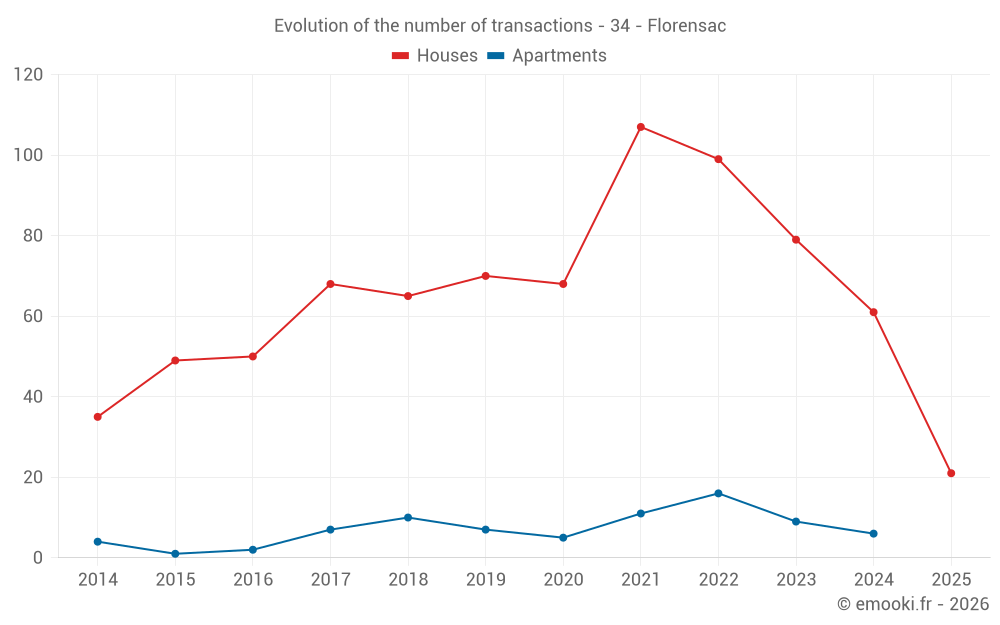
Median price on the 21 transactions of the last 6 months.
from 1 889 to
3 466 € /m²
3 466 € /m²
60% of transactions from the 2nd to the 8th deciles.
Apartments
1 512 € /m²
Reliability 6/10
Median price on the 24 transactions of the last 36 months.
from 1 273 to
2 264 € /m²
2 264 € /m²
60% of transactions from the 2nd to the 8th deciles.
Dwellings
2 574 € /m²
Reliability 9/10
Median price on the 21 transactions of the last 6 months.
from 1 889 to
3 466 € /m²
3 466 € /m²
60% of transactions from the 2nd to the 8th deciles.