Real estate price map
Real estate price map in the municipality of Buzignargues, choose a section to see transactions by parcel.
Hérault (34)
Price per m² in Buzignargues
Median price of real estate
in the municipality of Buzignargues
Houses
3 297 € /m²
Reliability 5/10
Median price on the 10 transactions of the last 48 months.
Apartments
2 874 € /m²
Reliability 2/10
Median price on the 4 transactions of the last 96 months.
Dwellings
3 449 € /m²
Reliability 5/10
Median price on the 12 transactions of the last 48 months.
from 1 848 to
3 844 € /m²
3 844 € /m²
60% of transactions from the 2nd to the 8th deciles.
Yearly evolution
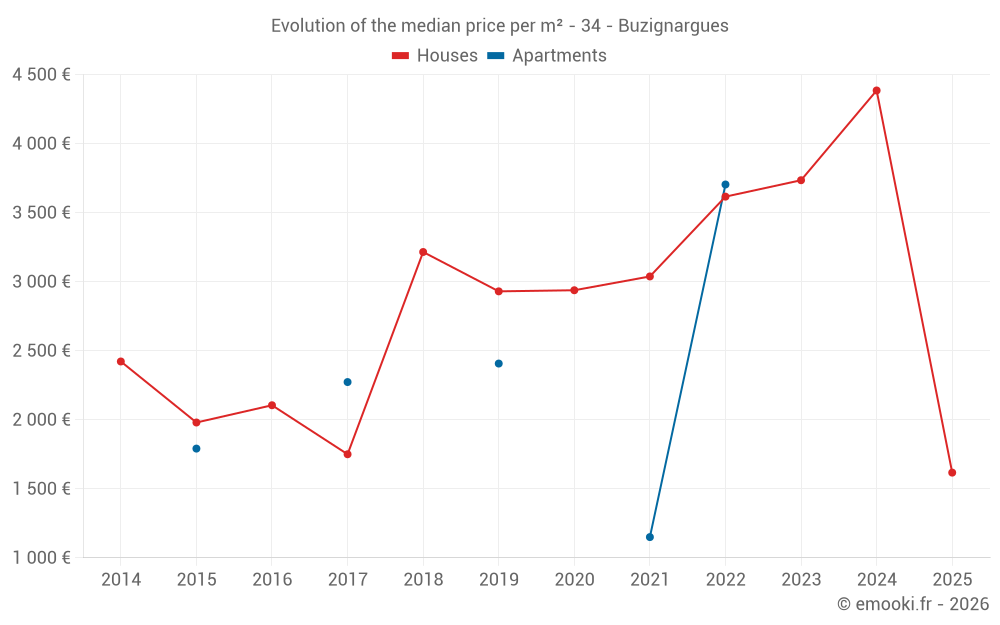
Evolution of the median price per m²
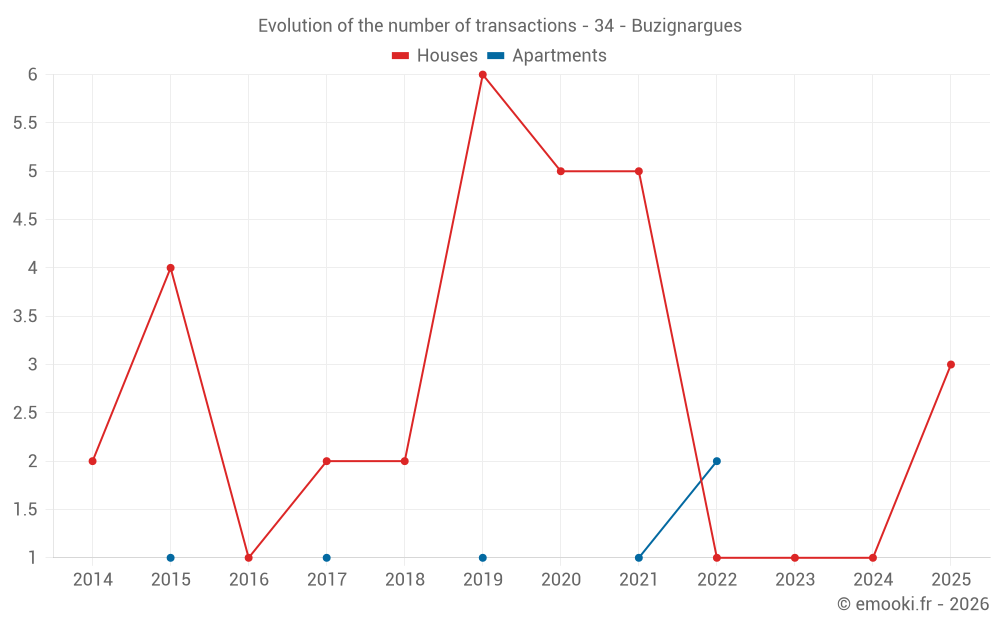
Evolution of the number of transactions
Warning, last year incomplete. Projections made based on the proportions between semesters of the previous year at the departmental/national level and by type of property.
Yearly data
Year
house
transactions
transactions
house
Price per m²
Price per m²
apt.
transactions
transactions
apt.
Price per m²
Price per m²
2025
3
1 617 €
0
--- €
2024
1
4 385 €
0
--- €
2023
1
3 735 €
0
--- €
2022
1
3 616 €
2
3 704 €
2021
5
3 038 €
1
1 150 €
2020
5
2 938 €
0
--- €
2019
6
2 930 €
1
2 407 €
2018
2
3 215 €
0
--- €
2017
2
1 750 €
1
2 273 €
2016
1
2 105 €
0
--- €
2015
4
1 980 €
1
1 791 €
2014
2
2 422 €
0
--- €
Analysis
Structure of prices per m²
Values of price percentiles per m² over the periods used for the estimated price of each type of property.
Structure of transaction amounts
Values of transaction amounts percentiles over the periods used for the estimated price of each type of property.
Transaction amounts and prices per m² by percentile
Percentile
house
Price per m²
Price per m²
house
Transaction amount
Transaction amount
apt.
Price per m²
Price per m²
apt.
Transaction amount
Transaction amount
10th percentile
1 428 €
111 K€
1 527 €
112 K€
20th percentile
1 587 €
217 K€
1 904 €
132 K€
30th percentile
2 426 €
257 K€
2 281 €
152 K€
40th percentile
2 932 €
267 K€
2 594 €
171 K€
50th percentile
3 297 €
314 K€
2 874 €
190 K€
60th percentile
3 580 €
359 K€
3 155 €
208 K€
70th percentile
3 652 €
374 K€
3 414 €
272 K€
80th percentile
3 762 €
409 K€
3 632 €
428 K€
90th percentile
3 922 €
441 K€
3 849 €
584 K€
National and departmental comparison
Evolution of the median price per m² of houses
Evolution of the median price per m² of apartments
Quarterly evolution
Evolution of the median price per m²
Evolution of the number of transactions
Quarterly data
Quarter
house
transactions
transactions
house
Price per m²
Price per m²
apt.
transactions
transactions
apt.
Price per m²
Price per m²
2025 Q1
3
1 617 €
0
--- €
2024 Q4
1
4 385 €
0
--- €
2023 Q1
1
3 735 €
0
--- €
2022 Q4
0
--- €
1
3 342 €
2022 Q3
1
3 616 €
0
--- €
2022 Q2
0
--- €
1
4 066 €
2021 Q4
1
2 773 €
0
--- €
2021 Q3
3
3 038 €
0
--- €
2021 Q1
1
3 482 €
1
1 150 €
2020 Q3
3
2 938 €
0
--- €
2020 Q2
2
2 914 €
0
--- €
2019 Q4
1
2 528 €
0
--- €
2019 Q3
1
2 255 €
0
--- €
2019 Q2
2
2 989 €
0
--- €
2019 Q1
2
3 272 €
1
2 407 €
2018 Q3
1
2 292 €
0
--- €
2018 Q2
1
4 138 €
0
--- €
2017 Q3
1
1 950 €
0
--- €
2017 Q2
1
1 550 €
1
2 273 €
2016 Q1
1
2 105 €
0
--- €
2015 Q4
2
1 106 €
0
--- €
2015 Q3
1
2 102 €
1
1 791 €
2015 Q2
1
2 844 €
0
--- €
2014 Q4
1
2 273 €
0
--- €
2014 Q2
1
2 571 €
0
--- €
Overview of the latest real estate transactions
The following list is an anonymized overview of the latest transactions. For more details and to find all transactions, please use the map to view transactions by plot or the transaction search page for a search by criteria.
2025-06-27
303 000 €Sale
Land
1273 m2
-Taillis simples
Land
144 m2
-Sols
2025-05-05
28 000 €Sale
Land
8562 m2
-Taillis simples
Land
2410 m2
-Taillis simples
Land
34622 m2
-Taillis simples
2025-04-29
35 000 €Sale
Land
950 m2
-Landes
Land
585 m2
-Landes
Land
450 m2
-Landes
Land
270 m2
-Landes
2025-03-27
242 500 €1 617 € /m²(150 m²)
Sale
House
7 rooms
150 m2
Land
444 m2
-Sols
2025-03-07
405 356 €3 556 € /m²(114 m²)
Sale
House
3 rooms
114 m2
Land
400 m2
-Sols
2025-01-09
96 000 €1 091 € /m²(88 m²)
Sale
House
3 rooms
88 m2
Land
1186 m2
-Sols
2024-10-28
263 100 €4 385 € /m²(60 m²)
Sale
House
2 rooms
60 m2
Land
528 m2
-Sols
2024-09-24
8 000 €Sale
Land
19942 m2
-Taillis simples
2024-06-07
20 000 €Sale
Land
24885 m2
-Vignes
Land
100 m2
-Sols
2024-03-26
34 000 €Sale
Land
160 m2
-Landes
Land
1790 m2
-Taillis simples
/CHENE
Land
1190 m2
-Taillis simples
/CHENE
Land
510 m2
-Landes
/Pâture plantée
Land
190 m2
-Landes
Land
1150 m2
-Taillis simples
Land
1128 m2
-Taillis simples
Land
6014 m2
-Terres
Land
11406 m2
-Terres
2024-03-05
3 000 €Sale
Land
603 m2
-Taillis simples
Land
2571 m2
-Taillis simples
2023-12-18
562 €Sale
Land
71 m2
-Terres
2023-07-27
1 520 €Sale
Land
881 m2
-Terres
Land
22 m2
-Terres
Land
614 m2
-Sols
2023-07-27
35 €0Sale
House
7 rooms
159 m2
2 outbuildings
2023-01-17
425 749 €3 735 € /m²(114 m²)
Sale
House
3 rooms
114 m2
Land
400 m2
-Sols
2022-12-09
1 000 €Sale
Land
36 m2
-Sols
2022-11-15
220 550 €3 342 € /m²(66 m²)
Sale
Apartment
3 rooms
66 m2
1 outbuilding
2022-08-02
575 000 €3 616 € /m²(159 m²)
Sale
House
3 rooms
159 m2
1 outbuilding
Land
793 m2
-Sols
2022-08-01
350 €Sale
Land
788 m2
-Taillis simples
2022-07-26
84 €Sale
Land
33 m2
-Terres
Land
51 m2
-Sols
103 transactions listed in the municipality
Compare with neighboring municipalities
City
name
name
house
Price per m²
Price per m²
apt.
Price per m²
Price per m²
City information
Zip code
- 34160 BUZIGNARGUES
Data source & update
- Latest publication of the property value request (DVF) database made available by the DGFiP on October 19, 2025, covering transactions up to 06/30/2025:
- Administrative/cadastral division as of September 1, 2025, and municipal movements as of January 1, 2025: