Real estate price map
Real estate price map in the municipality of Saint-Denis-de-Pile, choose a section to see transactions by parcel.
Price per m² in Saint-Denis-de-Pile
Median price of real estate
in the municipality of Saint-Denis-de-Pile
2 373 € /m²
1 944 € /m²
2 327 € /m²
Yearly evolution
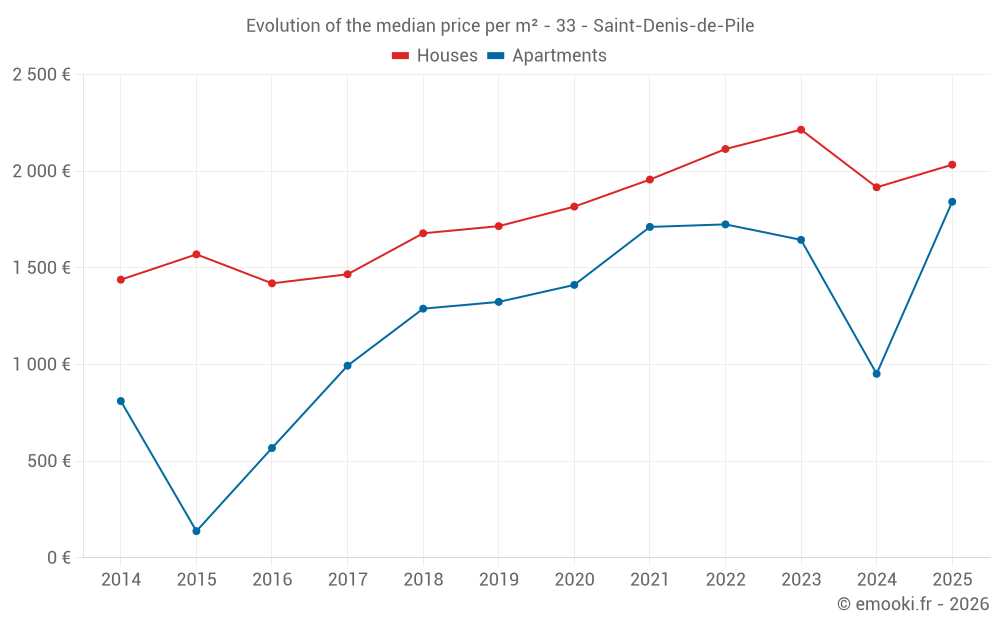
Evolution of the median price per m²
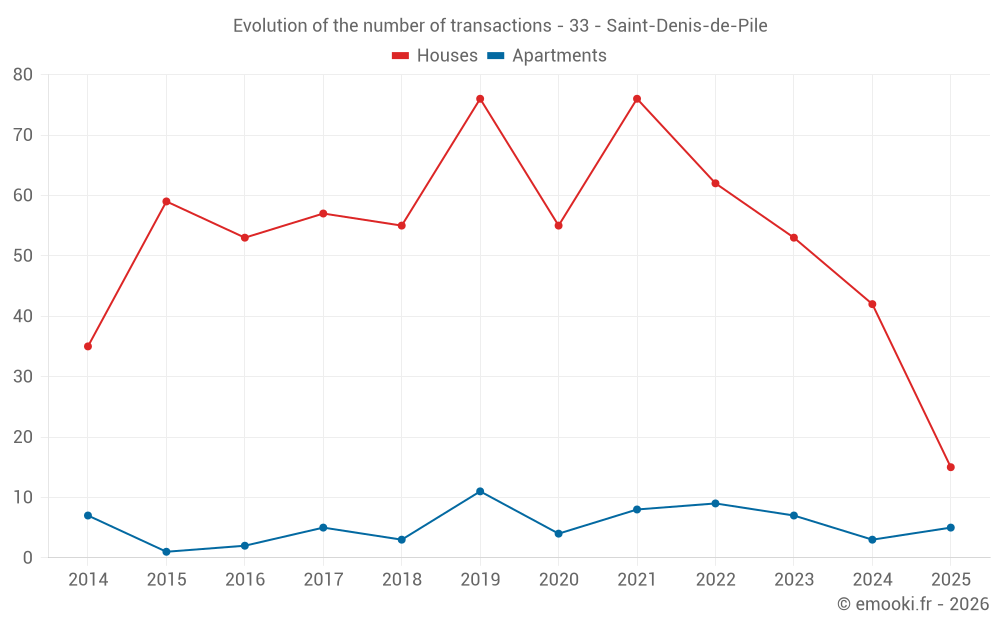
Evolution of the number of transactions
Warning, last year incomplete. Projections made based on the proportions between semesters of the previous year at the departmental/national level and by type of property.
Yearly data
transactions
Price per m²
transactions
Price per m²
Analysis
Structure of prices per m²
Values of price percentiles per m² over the periods used for the estimated price of each type of property.
Structure of transaction amounts
Values of transaction amounts percentiles over the periods used for the estimated price of each type of property.
Transaction amounts and prices per m² by percentile
Price per m²
Transaction amount
Price per m²
Transaction amount
National and departmental comparison
Evolution of the median price per m² of houses
Evolution of the median price per m² of apartments
Quarterly evolution
Evolution of the median price per m²
Evolution of the number of transactions
Quarterly data
transactions
Price per m²
transactions
Price per m²
Overview of the latest real estate transactions
The following list is an anonymized overview of the latest transactions. For more details and to find all transactions, please use the map to view transactions by plot or the transaction search page for a search by criteria.
Key takeaways
What is the price per m2 of houses in Saint-Denis-de-Pile?
The median price on the 43 house transactions of the last 12 months in the municipality of Saint-Denis-de-Pile was 1 845 € per square meter for a median property value of 177 000 €. Over this period, 60% of transactions were between 1 230 and 2 373 € per square meter (from the 2nd to the 8th deciles).
Compare with neighboring municipalities
name
Price per m²
Price per m²
City information
Zip code
- 33910 ST DENIS DE PILE
Data source & update
- Latest publication of the property value request (DVF) database made available by the DGFiP on October 19, 2025, covering transactions up to 06/30/2025:
- Administrative/cadastral division as of September 1, 2025, and municipal movements as of January 1, 2025: