emooki
HomePrice mapTransactions
🇬🇧 English🇫🇷 Français🇩🇪 Deutsch🇪🇸 Español🇮🇹 Italiano

Real estate price map


Real estate price map in the municipality of Carbon-Blanc, choose a section to see transactions by parcel.

Gironde (33)
Carbon-Blanc

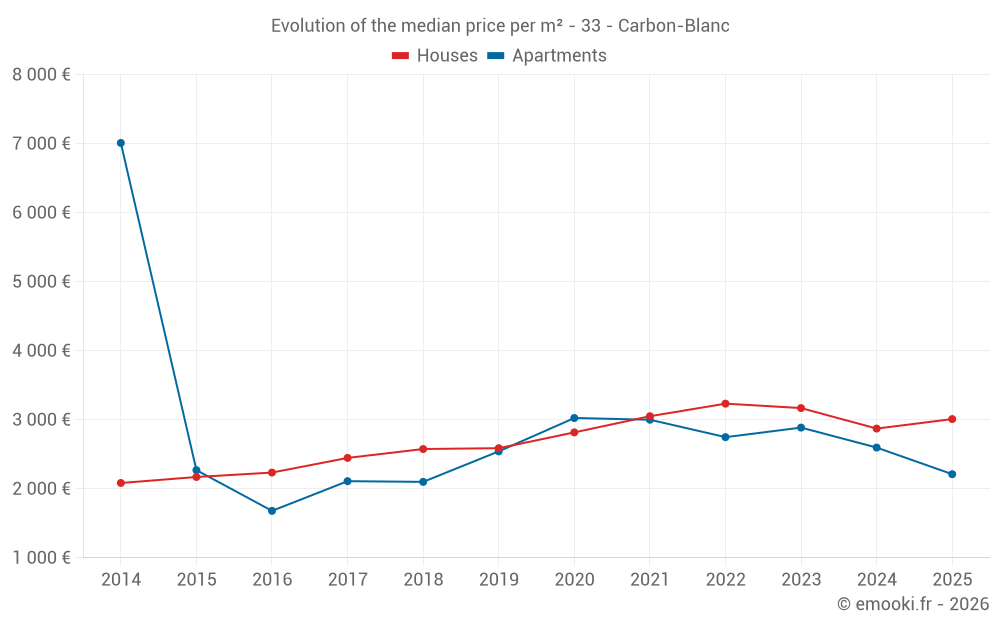
Median price of real estate
in the municipality of Carbon-Blanc

HousesHouses
3 010 € /m²
1-23-45-67-89-10
Reliability 9/10
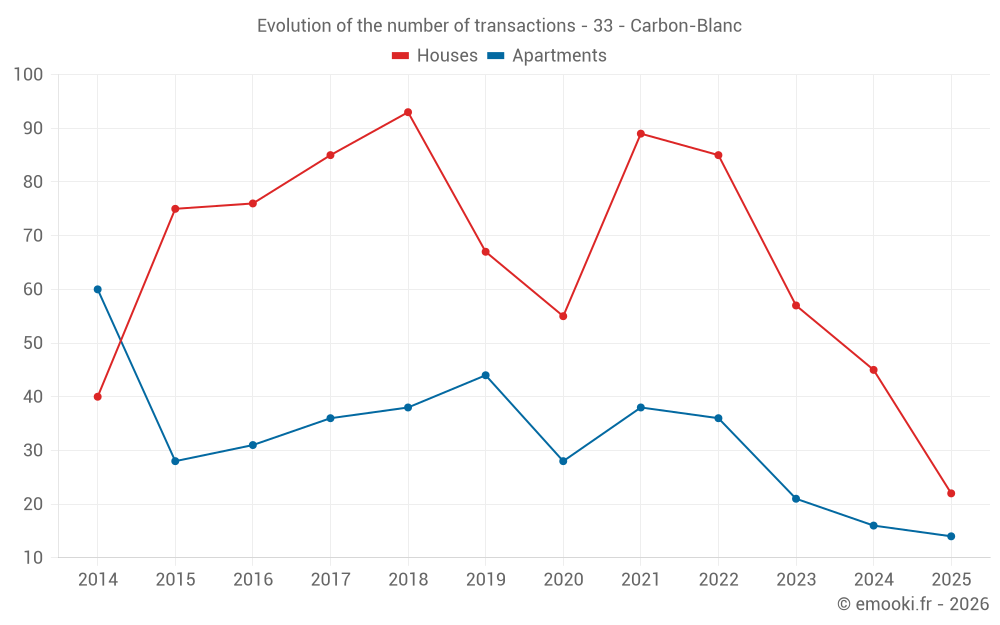
Median price on the 22 transactions of the last 6 months.
from 2 229 to
3 567 € /m²
60% of transactions from the 2nd to the 8th deciles.
ApartmentsApartments
2 320 € /m²
1-23-45-67-89-10
Reliability 8/10
Median price on the 24 transactions of the last 12 months.
from 1 946 to
2 759 € /m²
60% of transactions from the 2nd to the 8th deciles.
DwellingsDwellings
2 733 € /m²
1-23-45-67-89-10
Reliability 10/10
Median price on the 23 transactions of the last 3 months.
from 1 938 to
3 182 € /m²
60% of transactions from the 2nd to the 8th deciles.
HousesEvolution of the price per m² of houses since...
1 year
+4.8%
2 years
-5%
3 years
-6.9%
4 years
-1.3%
5 years
+6.9%
6 years
+16%
7 years
+17%
8 years
+23%
9 years
+35%
10 years
+39%
11 years
+44%
The price per m² of houses has decreased by 6.9% since 3 years, but it has increased by 44% in 11 years.
ApartmentsEvolution of the price per m² of apartments since...
1 year
-15%
2 years
-23%
3 years
-20%
4 years
-26%
5 years
-27%
6 years
-13%
7 years
+5.3%
8 years
+4.8%
9 years
+32%
10 years
-2.6%
11 years
-68%
The price per m² of apartments has increased by 32% since 9 years, but it has decreased by 68% in 11 years.

Yearly evolution

Evolution of the median price per m²

Evolution of the number of transactions

Warning, last year incomplete. Projections made based on the proportions between semesters of the previous year at the departmental/national level and by type of property.

Yearly data

Descending order
Year
Houses
house
transactions
Houses
house
Price per m²
Apartments
apt.
transactions
Apartments
apt.
Price per m²
2025
22
3 010 €
14
2 211 €
2024
45
2 872 €
16
2 597 €
2023
57
3 169 €
21
2 886 €
2022
85
3 233 €
36
2 748 €
2021
89
3 051 €
38
3 000 €
2020
55
2 817 €
28
3 025 €
2019
67
2 588 €
44
2 542 €
2018
93
2 576 €
38
2 100 €
2017
85
2 447 €
36
2 110 €
2016
76
2 235 €
31
1 680 €
2015
75
2 171 €
28
2 270 €
2014
40
2 084 €
60
7 010 €

Analysis

Structure of prices per m²

Values of price percentiles per m² over the periods used for the estimated price of each type of property.

Structure of transaction amounts

Values of transaction amounts percentiles over the periods used for the estimated price of each type of property.

Transaction amounts and prices per m² by percentile

Ascending order
Percentile
Houses
house
Price per m²
Houses
house
Transaction amount
Apartments
apt.
Price per m²
Apartments
apt.
Transaction amount
10th percentile
1 769 €
155 K€
1 886 €
119 K€
20th percentile
2 229 €
211 K€
1 946 €
129 K€
30th percentile
2 715 €
230 K€
2 121 €
132 K€
40th percentile
2 902 €
237 K€
2 185 €
140 K€
50th percentile
3 010 €
251 K€
2 320 €
152 K€
60th percentile
3 099 €
276 K€
2 428 €
165 K€
70th percentile
3 182 €
288 K€
2 594 €
169 K€
80th percentile
3 567 €
335 K€
2 759 €
179 K€
90th percentile
4 763 €
404 K€
2 911 €
196 K€

National and departmental comparison

Evolution of the median price per m² of houses

Evolution of the median price per m² of apartments

Quarterly evolution

Evolution of the median price per m²

Evolution of the number of transactions

Quarterly data

Descending order
Quarter
Houses
house
transactions
Houses
house
Price per m²
Apartments
apt.
transactions
Apartments
apt.
Price per m²
2025 Q2
18
2 985 €
5
2 586 €
2025 Q1
4
3 298 €
9
2 167 €
2024 Q4
9
2 790 €
4
2 233 €
2024 Q3
10
2 981 €
6
2 634 €
2024 Q2
15
2 626 €
1
2 776 €
2024 Q1
11
3 182 €
5
2 617 €
2023 Q4
11
3 099 €
5
3 333 €
2023 Q3
12
3 240 €
3
3 031 €
2023 Q2
12
3 358 €
5
2 780 €
2023 Q1
22
3 017 €
8
2 638 €
2022 Q4
14
3 271 €
7
2 464 €
2022 Q3
23
3 144 €
15
2 723 €
2022 Q2
25
3 370 €
9
2 656 €
2022 Q1
23
3 011 €
5
3 000 €
2021 Q4
31
2 917 €
7
2 367 €
2021 Q3
23
3 145 €
11
2 984 €
2021 Q2
14
3 142 €
7
3 016 €
2021 Q1
21
2 966 €
13
3 256 €
2020 Q4
10
2 582 €
6
3 126 €
2020 Q3
17
2 824 €
9
2 910 €
2020 Q2
14
2 830 €
3
2 299 €
2020 Q1
14
2 870 €
10
3 672 €
2019 Q4
11
2 443 €
13
7 108 €
2019 Q3
20
2 434 €
8
2 158 €
2019 Q2
18
2 768 €
9
2 256 €
2019 Q1
18
2 626 €
14
1 980 €
2018 Q4
28
2 882 €
8
2 228 €
2018 Q3
25
2 556 €
6
2 120 €
2018 Q2
22
2 580 €
9
2 008 €
2018 Q1
18
2 452 €
15
2 036 €
2017 Q4
20
2 452 €
9
2 361 €
2017 Q3
20
2 276 €
9
1 929 €
2017 Q2
32
2 450 €
10
2 081 €
2017 Q1
13
2 544 €
8
2 234 €
2016 Q4
21
2 447 €
8
1 980 €
2016 Q3
17
2 079 €
12
1 608 €
2016 Q2
20
2 235 €
7
1 435 €
2016 Q1
18
2 282 €
4
2 232 €
2015 Q4
19
2 070 €
6
2 114 €
2015 Q3
30
2 296 €
11
1 620 €
2015 Q2
15
2 167 €
5
1 635 €
2015 Q1
11
2 075 €
6
7 068 €
2014 Q4
9
1 924 €
13
6 991 €
2014 Q3
13
2 366 €
27
7 021 €
2014 Q2
12
2 084 €
13
7 046 €
2014 Q1
6
2 050 €
7
2 872 €

Overview of the latest real estate transactions

The following list is an anonymized overview of the latest transactions. For more details and to find all transactions, please use the map to view transactions by plot or the transaction search page for a search by criteria.

2025-06-10
178 565 €
8 117 € /m²(22 m²)
Sale
Commercial property
22 m2
2025-06-06
197 200 €
2 665 € /m²(74 m²)
Sale
Apartments
Apartment
3 rooms
74 m2
2025-06-06
6 000 €
Sale
1 outbuilding
2025-06-04
276 000 €
2 733 € /m²(101 m²)
Sale
Houses
House
5 rooms
101 m2
Land
307 m2
-Sols
Land
70 m2
-Sols
2025-06-02
79 000 €
3 292 € /m²(24 m²)
Sale
Commercial property
24 m2
2025-05-30
239 420 €
2 574 € /m²(93 m²)
Sale
Houses
House
4 rooms
93 m2
1 outbuilding
Land
849 m2
-Sols
2025-05-23
114 100 €
5 186 € /m²(22 m²)
Sale
Commercial property
22 m2
2025-05-21
215 000 €
3 028 € /m²(71 m²)
Sale
Houses
House
3 rooms
71 m2
Land
272 m2
-Sols
2025-05-21
6 993 149 €
35 679 € /m²(196 m²)
Sale
Houses
House
6 rooms
196 m2
1 outbuilding
Land
3200 m2
-Prés
Land
2172 m2
-Vignes
Land
1763 m2
-Sols
1 outbuilding
Land
89 m2
-Sols
2025-05-07
346 500 €
2 707 € /m²(128 m²)
Sale
Houses
House
5 rooms
128 m2
1 outbuilding
Land
554 m2
-Sols
2025-04-30
1 200 000 €
6 122 € /m²(196 m²)
Sale
Houses
House
6 rooms
196 m2
1 outbuilding
Land
1763 m2
-Sols
Land
2172 m2
-Vignes
Land
3200 m2
-Prés
1 outbuilding
Land
89 m2
-Sols
2025-04-25
290 000 €
3 021 € /m²(96 m²)
Sale
Houses
House
5 rooms
96 m2
Land
487 m2
-Sols
2025-04-25
138 731 €
2 011 € /m²(69 m²)
Sale
Apartments
Apartment
4 rooms
69 m2
1 outbuilding
2025-04-25
262 000 €
1 724 € /m²(152 m²)
Sale
Houses
House
6 rooms
152 m2
1 outbuilding
2025-04-18
155 150 €
2 586 € /m²(60 m²)
Sale
Apartments
Apartment
3 rooms
60 m2
1 outbuilding
2025-04-18
115 400 €
5 245 € /m²(22 m²)
Sale
Commercial property
22 m2
2025-04-18
185 000 €
Sale
Land
53 m2
-Jardins
Land
1735 m2
-Terrains d'agrément
2025-04-18
168 925 €
2 863 € /m²(59 m²)
Sale
Apartments
Apartment
3 rooms
59 m2
1 outbuilding
2025-04-18
231 500 €
4 134 € /m²(56 m²)
Sale
Houses
House
3 rooms
56 m2
Land
339 m2
-Sols
Land
68 m2
-Terres
2025-04-18
132 500 €
1 425 € /m²(93 m²)
Sale
Houses
House
5 rooms
93 m2
1672 transactions listed in the municipality

Gironde (33)

Most expensive cities

City
name
Descending orderHouses
house
Price per m²
9 000 €
8 517 €
5 211 €
5 208 €
4 827 €
4 704 €
4 627 €
4 557 €
4 328 €
4 324 €
City
name
Descending orderApartments
apt.
Price per m²
11 029 €
9 410 €
7 624 €
6 698 €
5 771 €
5 106 €
4 896 €
4 585 €
4 500 €
4 162 €

Least expensive cities

City
name
Ascending orderHouses
house
Price per m²
737 €
831 €
884 €
917 €
952 €
972 €
1 000 €
1 014 €
1 034 €
City
name
Ascending orderApartments
apt.
Price per m²
24 €
202 €
203 €
336 €
400 €
430 €
435 €
447 €
456 €
462 €