emooki
HomePrice mapTransactions
🇬🇧 English🇫🇷 Français🇩🇪 Deutsch🇪🇸 Español🇮🇹 Italiano

Real estate price map


Real estate price map in the municipality of Biganos, choose a section to see transactions by parcel.

Gironde (33)

Biganos - Real estate price m²

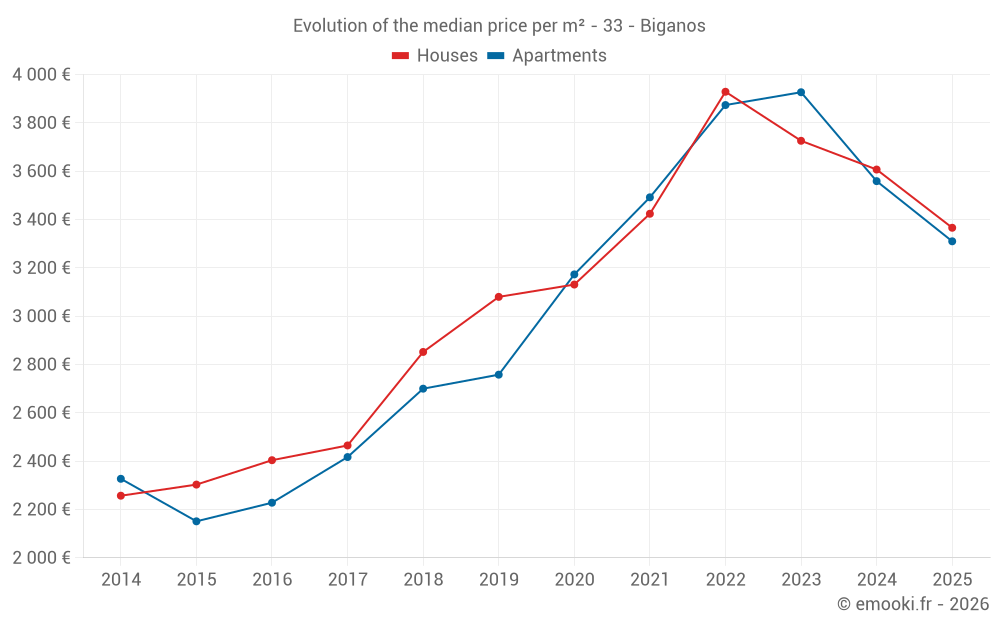
Median price of real estate
in the municipality of Biganos

HousesHouses
3 114  /m²
1-23-45-67-89-10
Reliability 10/10
Median price on the 20 transactions of the last 3 months.
from 2 604 to
3 632  /m²
60% of transactions from the 2nd to the 8th deciles.
ApartmentsApartments
3 310  /m²
1-23-45-67-89-10
Reliability 9/10
Median price on the 22 transactions of the last 6 months.
from 2 999 to
3 649  /m²
60% of transactions from the 2nd to the 8th deciles.
DwellingsDwellings
3 230  /m²
1-23-45-67-89-10
Reliability 10/10
Median price on the 33 transactions of the last 3 months.
from 2 794 to
3 648  /m²
60% of transactions from the 2nd to the 8th deciles.
HousesEvolution of the price per m² of houses since...
1 year
-6.7%
2 years
-10%
3 years
-14%
4 years
-1.7%
5 years
+7.5%
6 years
+9.3%
7 years
+18%
8 years
+37%
9 years
+40%
10 years
+46%
11 years
+49%
The price per m² of houses has decreased by 14% since 3 years, but it has increased by 49% in 11 years.
ApartmentsEvolution of the price per m² of apartments since...
1 year
-7%
2 years
-16%
3 years
-15%
4 years
-5.2%
5 years
+4.3%
6 years
+20%
7 years
+23%
8 years
+37%
9 years
+49%
10 years
+54%
11 years
+42%
The price per m² of apartments has decreased by 16% since 2 years, but it has increased by 54% in 10 years.

Yearly evolution

Evolution of the median price per m²

Evolution of the median price per m² - 33 - Biganos

Evolution of the number of transactions

Warning, last year incomplete. Projections made based on the proportions between semesters of the previous year at the departmental/national level and by type of property.

Evolution of the number of transactions - 33 - Biganos

Yearly data

Descending order
Year
Houses
house
transactions
Houses
house
Price per m²
Apartments
apt.
transactions
Apartments
apt.
Price per m²
2025
46
3 366 
22
3 310 
2024
80
3 607 
25
3 559 
2023
108
3 726 
24
3 927 
2022
156
3 929 
44
3 874 
2021
164
3 424 
40
3 492 
2020
132
3 131 
34
3 173 
2019
132
3 080 
53
2 758 
2018
131
2 852 
47
2 700 
2017
143
2 465 
40
2 417 
2016
139
2 404 
30
2 228 
2015
121
2 303 
14
2 151 
2014
86
2 257 
15
2 327 

Analysis

Structure of prices per m²

Values of price percentiles per m² over the periods used for the estimated price of each type of property.

Structure of transaction amounts

Values of transaction amounts percentiles over the periods used for the estimated price of each type of property.

Transaction amounts and prices per m² by percentile

Ascending order
Percentile
Houses
house
Price per m²
Houses
house
Transaction amount
Apartments
apt.
Price per m²
Apartments
apt.
Transaction amount
10th percentile
2 269 
214 K
2 756 
133 K
20th percentile
2 604 
223 K
2 999 
141 K
30th percentile
2 823 
235 K
3 136 
149 K
40th percentile
2 978 
264 K
3 230 
163 K
50th percentile
3 114 
290 K
3 310 
166 K
60th percentile
3 278 
337 K
3 452 
174 K
70th percentile
3 502 
352 K
3 601 
186 K
80th percentile
3 632 
362 K
3 649 
209 K
90th percentile
4 000 
389 K
3 800 
224 K

National and departmental comparison

Evolution of the median price per m² of houses

Evolution of the median price per m² of apartments

Quarterly evolution

Evolution of the median price per m²

Evolution of the number of transactions

Quarterly data

Descending order
Quarter
Houses
house
transactions
Houses
house
Price per m²
Apartments
apt.
transactions
Apartments
apt.
Price per m²
2025 Q2
20
3 114 
13
3 462 
2025 Q1
26
3 598 
9
3 256 
2024 Q4
21
3 500 
8
3 184 
2024 Q3
25
3 688 
2
3 090 
2024 Q2
22
3 525 
10
3 738 
2024 Q1
12
3 650 
5
3 661 
2023 Q4
20
3 550 
6
3 754 
2023 Q3
28
3 676 
7
4 025 
2023 Q2
30
4 176 
4
3 982 
2023 Q1
30
3 588 
7
4 102 
2022 Q4
34
3 712 
5
4 049 
2022 Q3
45
4 107 
16
4 074 
2022 Q2
47
4 120 
13
3 778 
2022 Q1
30
3 519 
10
3 718 
2021 Q4
47
3 514 
9
3 537 
2021 Q3
58
3 345 
12
3 576 
2021 Q2
35
3 335 
12
3 210 
2021 Q1
24
3 618 
7
3 510 
2020 Q4
49
3 132 
11
3 556 
2020 Q3
33
3 058 
2
3 462 
2020 Q2
28
3 262 
8
3 331 
2020 Q1
22
3 086 
13
3 070 
2019 Q4
35
3 267 
9
2 758 
2019 Q3
43
3 139 
18
2 826 
2019 Q2
31
2 844 
13
2 786 
2019 Q1
23
3 000 
13
2 625 
2018 Q4
29
2 858 
15
2 857 
2018 Q3
35
2 904 
9
2 791 
2018 Q2
30
3 006 
10
2 732 
2018 Q1
37
2 519 
13
2 375 
2017 Q4
38
2 336 
10
2 576 
2017 Q3
43
2 662 
15
2 429 
2017 Q2
30
2 460 
11
2 375 
2017 Q1
32
2 406 
4
2 375 
2016 Q4
42
2 430 
12
2 350 
2016 Q3
33
2 482 
8
2 414 
2016 Q2
36
2 346 
4
2 218 
2016 Q1
28
2 270 
6
2 013 
2015 Q4
33
2 061 
7
1 972 
2015 Q3
41
2 294 
0
--- 
2015 Q2
24
2 528 
2
2 276 
2015 Q1
23
2 222 
5
2 260 
2014 Q4
20
2 215 
4
2 245 
2014 Q3
27
2 210 
3
2 327 
2014 Q2
20
2 302 
3
2 470 
2014 Q1
19
2 409 
5
1 939 

Overview of the latest real estate transactions

The following list is an anonymized overview of the latest transactions. For more details and to find all transactions, please use the map to view transactions by plot or the transaction search page for a search by criteria.

2025-06-26
7 500 
Sale
Land
4180 m2
-Futaies résineuses
/Pins
Land
1197 m2
-Landes
Land
2793 m2
-Futaies résineuses
/Pins
Land
3960 m2
-Futaies résineuses
/Pins
2025-06-20
188 950 
2 999  /m²(63 m²)
Sale
Apartments
Apartment
3 rooms
63 m2
2 outbuildings
2025-06-20
1 
transaction.nature.Vente terrain à bâtir
Land
2899 m2
-Sols
Land
528 m2
-Sols
Land
1218 m2
-Sols
Land
999 m2
-Terrains à bâtir
2025-06-17
2 000 
Sale
Land
318 m2
-Landes
Land
1947 m2
-Landes
Land
21 m2
-Sols
Land
11 m2
-Landes
Land
53 m2
-Landes
Land
275 m2
-Landes
Land
1142 m2
-Landes
Land
3015 m2
-Landes
Land
3529 m2
-Landes
2025-06-17
300 000 
3 061  /m²(98 m²)
Sale
Commercial property
98 m2
2025-06-16
45 000 
Sale
Land
11743 m2
-Bois
2025-06-06
500 
Sale
Land
1353 m2
-Landes
2025-06-04
426 208 
4 440  /m²(96 m²)
Sale
Houses
House
4 rooms
96 m2
2 outbuildings
Land
1167 m2
-Sols
2025-06-02
212 800 
3 669  /m²(58 m²)
Sale
Apartments
Apartment
3 rooms
58 m2
1 outbuilding
2025-05-30
385 000 
3 130  /m²(123 m²)
Sale
Houses
House
5 rooms
123 m2
1 outbuilding
Land
709 m2
-Sols
2025-05-28
177 500 
3 114  /m²(57 m²)
Sale
Apartments
Apartment
3 rooms
57 m2
1 outbuilding
2025-05-27
215 000 
2 756  /m²(78 m²)
Sale
Houses
House
3 rooms
78 m2
1 outbuilding
Land
732 m2
-Sols
2025-05-26
363 027 
2 017  /m²(180 m²)
Sale
Houses
House
4 rooms
180 m2
Land
500 m2
-Sols
Land
765 m2
-Terrains d'agrément
Land
33 m2
-Sols
2025-05-23
475 860 
2 658  /m²(179 m²)
Sale
Houses
House
3 rooms
59 m2
Houses
House
4 rooms
120 m2
1 outbuilding
Land
1500 m2
-Terrains d'agrément
Land
500 m2
-Sols
Land
222 m2
-Sols
2025-05-23
361 900 
3 351  /m²(108 m²)
Sale
Land
4 m2
-Landes
Land
29 m2
-Terrains d'agrément
Land
81 m2
-Sols
Houses
House
4 rooms
108 m2
Land
540 m2
-Sols
2025-05-23
203 000 
2 388  /m²(85 m²)
Sale
Houses
House
4 rooms
85 m2
1 outbuilding
Land
548 m2
-Sols
Land
44 m2
-Sols
2025-05-21
125 400 
1 100  /m²(114 m²)
Sale
Houses
House
6 rooms
114 m2
1 outbuilding
Land
733 m2
-Sols
2025-05-20
180 000 
2 727  /m²(66 m²)
Sale
Apartments
Apartment
3 rooms
66 m2
2 outbuildings
2025-05-19
220 000 
3 667  /m²(60 m²)
Sale
Houses
House
3 rooms
60 m2
3 outbuildings
2025-05-12
225 000 
3 462  /m²(65 m²)
Sale
Apartments
Apartment
3 rooms
65 m2
2 outbuildings
2875 transactions listed in the municipality

Gironde (33)

Most expensive cities

City
name
Descending orderHouses
house
Price per m²
9 000 
8 517 
5 211 
5 208 
4 827 
4 627 
4 557 
4 328 
4 324 
City
name
Descending orderApartments
apt.
Price per m²
9 410 
7 624 
5 771 
5 106 
4 896 
4 162 

Least expensive cities

City
name
Ascending orderHouses
house
Price per m²
831 
884 
917 
952 
972 
1 000 
1 014 
City
name
Ascending orderApartments
apt.
Price per m²
202 
336 
430 
435 
447 
456 
462