emooki
HomePrice mapTransactions
🇬🇧 English🇫🇷 Français🇩🇪 Deutsch🇪🇸 Español🇮🇹 Italiano

Real estate price map


Real estate price map in the municipality of Ambès, choose a section to see transactions by parcel.

Gironde (33)
Ambès

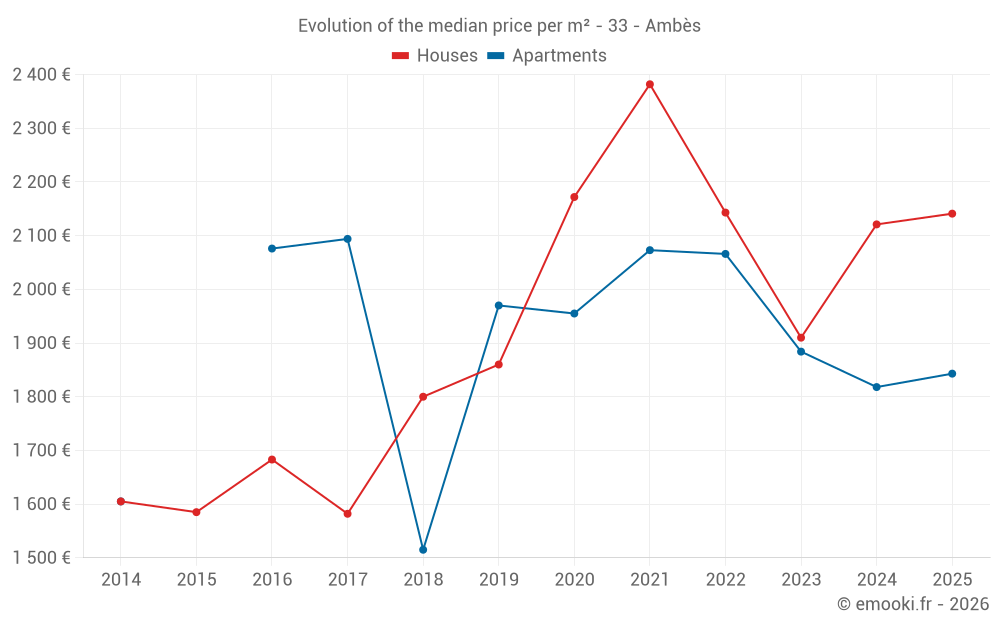
Median price of real estate
in the municipality of Ambès

HousesHouses
2 142  /m²
1-23-45-67-89-10
Reliability 8/10
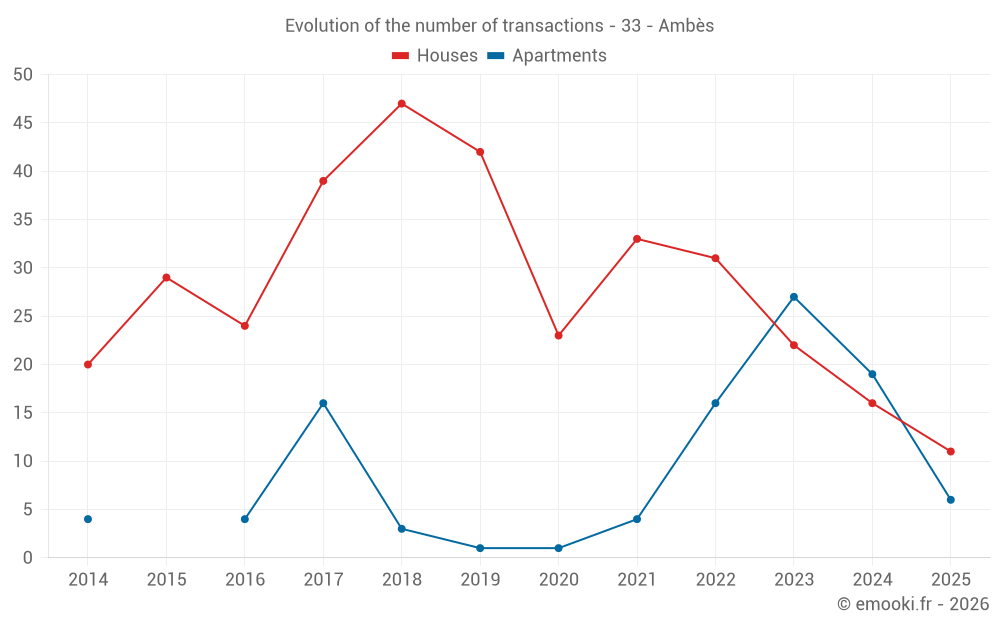
Median price on the 22 transactions of the last 12 months.
from 1 787 to
2 639  /m²
60% of transactions from the 2nd to the 8th deciles.
ApartmentsApartments
1 838  /m²
1-23-45-67-89-10
Reliability 8/10
Median price on the 20 transactions of the last 12 months.
from 1 671 to
1 915  /m²
60% of transactions from the 2nd to the 8th deciles.
DwellingsDwellings
1 860  /m²
1-23-45-67-89-10
Reliability 8/10
Median price on the 42 transactions of the last 12 months.
from 1 696 to
2 326  /m²
60% of transactions from the 2nd to the 8th deciles.
HousesEvolution of the price per m² of houses since...
1 year
+0.9%
2 years
+12%
3 years
-0.1%
4 years
-10%
5 years
-1.4%
6 years
+15%
7 years
+19%
8 years
+35%
9 years
+27%
10 years
+35%
11 years
+33%
The price per m² of houses has decreased by 10% since 4 years, but it has increased by 35% in 8 years.
ApartmentsEvolution of the price per m² of apartments since...
1 year
+1.4%
2 years
-2.2%
3 years
-11%
4 years
-11%
5 years
--
6 years
--
7 years
--
8 years
-12%
9 years
-11%
10 years
--
11 years
+15%
The price per m² of apartments has decreased by 12% since 8 years, but it has increased by 15% in 11 years.

Yearly evolution

Evolution of the median price per m²

Evolution of the number of transactions

Warning, last year incomplete. Projections made based on the proportions between semesters of the previous year at the departmental/national level and by type of property.

Yearly data

Descending order
Year
Houses
house
transactions
Houses
house
Price per m²
Apartments
apt.
transactions
Apartments
apt.
Price per m²
2025
11
2 141 
6
1 843 
2024
16
2 121 
19
1 818 
2023
22
1 910 
27
1 884 
2022
31
2 143 
16
2 066 
2021
33
2 382 
4
2 073 
2020
23
2 172 
1
1 955 
2019
42
1 860 
1
1 970 
2018
47
1 800 
3
1 515 
2017
39
1 582 
16
2 094 
2016
24
1 683 
4
2 076 
2015
29
1 585 
0
--- 
2014
20
1 605 
4
1 605 

Analysis

Structure of prices per m²

Values of price percentiles per m² over the periods used for the estimated price of each type of property.

Structure of transaction amounts

Values of transaction amounts percentiles over the periods used for the estimated price of each type of property.

Transaction amounts and prices per m² by percentile

Ascending order
Percentile
Houses
house
Price per m²
Houses
house
Transaction amount
Apartments
apt.
Price per m²
Apartments
apt.
Transaction amount
10th percentile
1 571 
142 K
1 478 
59 900 
20th percentile
1 787 
173 K
1 671 
72 000 
30th percentile
1 833 
180 K
1 802 
74 400 
40th percentile
2 008 
190 K
1 818 
79 200 
50th percentile
2 142 
198 K
1 838 
80 000 
60th percentile
2 287 
208 K
1 858 
84 000 
70th percentile
2 598 
217 K
1 861 
91 250 
80th percentile
2 639 
236 K
1 915 
110 K
90th percentile
2 867 
245 K
2 118 
120 K

National and departmental comparison

Evolution of the median price per m² of houses

Evolution of the median price per m² of apartments

Quarterly evolution

Evolution of the median price per m²

Evolution of the number of transactions

Quarterly data

Descending order
Quarter
Houses
house
transactions
Houses
house
Price per m²
Apartments
apt.
transactions
Apartments
apt.
Price per m²
2025 Q2
4
1 994 
1
1 857 
2025 Q1
7
2 625 
5
1 829 
2024 Q4
6
2 180 
8
1 862 
2024 Q3
5
2 099 
6
1 648 
2024 Q2
1
2 560 
4
1 861 
2024 Q1
4
1 813 
1
1 595 
2023 Q4
7
1 975 
9
1 693 
2023 Q3
3
1 823 
5
1 721 
2023 Q2
7
1 560 
7
2 051 
2023 Q1
5
2 159 
6
1 978 
2022 Q4
6
2 153 
3
2 131 
2022 Q3
8
2 422 
8
1 965 
2022 Q2
8
1 974 
1
2 182 
2022 Q1
9
2 134 
4
1 895 
2021 Q4
9
2 341 
2
2 410 
2021 Q3
11
2 369 
2
2 028 
2021 Q2
8
2 387 
0
--- 
2021 Q1
5
2 644 
0
--- 
2020 Q4
6
2 602 
0
--- 
2020 Q3
3
1 873 
0
--- 
2020 Q2
6
2 059 
0
--- 
2020 Q1
8
2 204 
1
1 955 
2019 Q4
8
1 746 
1
1 970 
2019 Q3
18
1 946 
0
--- 
2019 Q2
5
1 754 
0
--- 
2019 Q1
11
1 753 
0
--- 
2018 Q4
9
1 943 
1
2 321 
2018 Q3
15
1 810 
0
--- 
2018 Q2
13
1 643 
0
--- 
2018 Q1
10
1 878 
2
1 074 
2017 Q4
11
1 602 
0
--- 
2017 Q3
14
1 550 
4
2 028 
2017 Q2
7
1 452 
2
1 794 
2017 Q1
7
1 736 
10
2 108 
2016 Q4
5
1 646 
4
2 076 
2016 Q3
10
1 730 
0
--- 
2016 Q2
3
1 466 
0
--- 
2016 Q1
6
1 647 
0
--- 
2015 Q4
10
1 542 
0
--- 
2015 Q3
8
1 555 
0
--- 
2015 Q2
4
1 687 
0
--- 
2015 Q1
7
1 779 
0
--- 
2014 Q4
1
1 503 
2
1 624 
2014 Q3
5
1 784 
0
--- 
2014 Q2
5
1 699 
2
1 474 
2014 Q1
9
1 500 
0
--- 

Overview of the latest real estate transactions

The following list is an anonymized overview of the latest transactions. For more details and to find all transactions, please use the map to view transactions by plot or the transaction search page for a search by criteria.

2025-06-23
17 746 
Sale
Commercial property
2025-06-17
78 000 
1 857  /m²(42 m²)
Sale
Apartments
Apartment
2 rooms
42 m2
1 outbuilding
2025-06-12
179 840 
2 141  /m²(84 m²)
Sale
Houses
House
4 rooms
84 m2
Land
596 m2
-Sols
2025-05-15
200 000 
2 564  /m²(78 m²)
Sale
Houses
House
3 rooms
78 m2
Land
1193 m2
-Sols
2025-04-29
237 500 
1 827  /m²(130 m²)
Sale
Houses
House
4 rooms
130 m2
2 outbuildings
Land
1094 m2
-Sols
Land
3116 m2
-Prés
2025-04-24
205 000 
1 847  /m²(111 m²)
Sale
Houses
House
6 rooms
111 m2
Land
725 m2
-Sols
2025-04-08
3 500 
Sale
Land
426 m2
-Sols
2025-03-21
87 000 
2 231  /m²(39 m²)
Sale
Apartments
Apartment
2 rooms
39 m2
1 outbuilding
2025-03-18
195 500 
2 642  /m²(74 m²)
Sale
Houses
House
4 rooms
74 m2
Land
730 m2
-Sols
2025-03-07
85 000 
354  /m²(240 m²)
Sale
Commercial property
240 m2
Land
2638 m2
-Sols
2025-03-05
80 000 
1 860  /m²(43 m²)
Sale
Apartments
Apartment
2 rooms
43 m2
1 outbuilding
2025-03-05
1 000 
Sale
Land
2501 m2
-Terres
Land
421 m2
-Sols
2025-02-28
210 000 
2 625  /m²(80 m²)
Sale
Houses
House
3 rooms
80 m2
1 outbuilding
Land
584 m2
-Sols
2025-02-26
65 000 
1 048  /m²(62 m²)
Sale
Houses
House
3 rooms
62 m2
Land
592 m2
-Sols
2025-02-26
158 000 
1 564  /m²(101 m²)
Sale
Houses
House
5 rooms
101 m2
Land
380 m2
-Sols
2025-02-21
72 000 
1 674  /m²(43 m²)
Sale
Apartments
Apartment
2 rooms
43 m2
1 outbuilding
2025-01-22
188 000 
2 892  /m²(65 m²)
Sale
Houses
House
3 rooms
65 m2
1 outbuilding
Land
779 m2
-Sols
2025-01-13
73 000 
1 659  /m²(44 m²)
Sale
Apartments
Apartment
2 rooms
44 m2
1 outbuilding
2025-01-10
180 000 
1 800  /m²(100 m²)
Sale
Houses
House
4 rooms
100 m2
Land
414 m2
-Sols
2025-01-09
15 000 
Sale
Land
706 m2
-Terres
Land
1786 m2
-Terres
Land
4955 m2
-Terres
579 transactions listed in the municipality

Gironde (33)

Most expensive cities

City
name
Descending orderHouses
house
Price per m²
9 000 
8 517 
5 211 
5 208 
4 827 
4 627 
4 557 
4 328 
4 324 
City
name
Descending orderApartments
apt.
Price per m²
9 410 
7 624 
5 771 
5 106 
4 896 
4 162 

Least expensive cities

City
name
Ascending orderHouses
house
Price per m²
831 
884 
917 
952 
972 
1 000 
1 014 
City
name
Ascending orderApartments
apt.
Price per m²
202 
336 
430 
435 
447 
456 
462