emooki
HomePrice mapTransactions
🇬🇧 English🇫🇷 Français🇩🇪 Deutsch🇪🇸 Español🇮🇹 Italiano

Real estate price map


Real estate price map in the Gers department.

Department 32
Gers

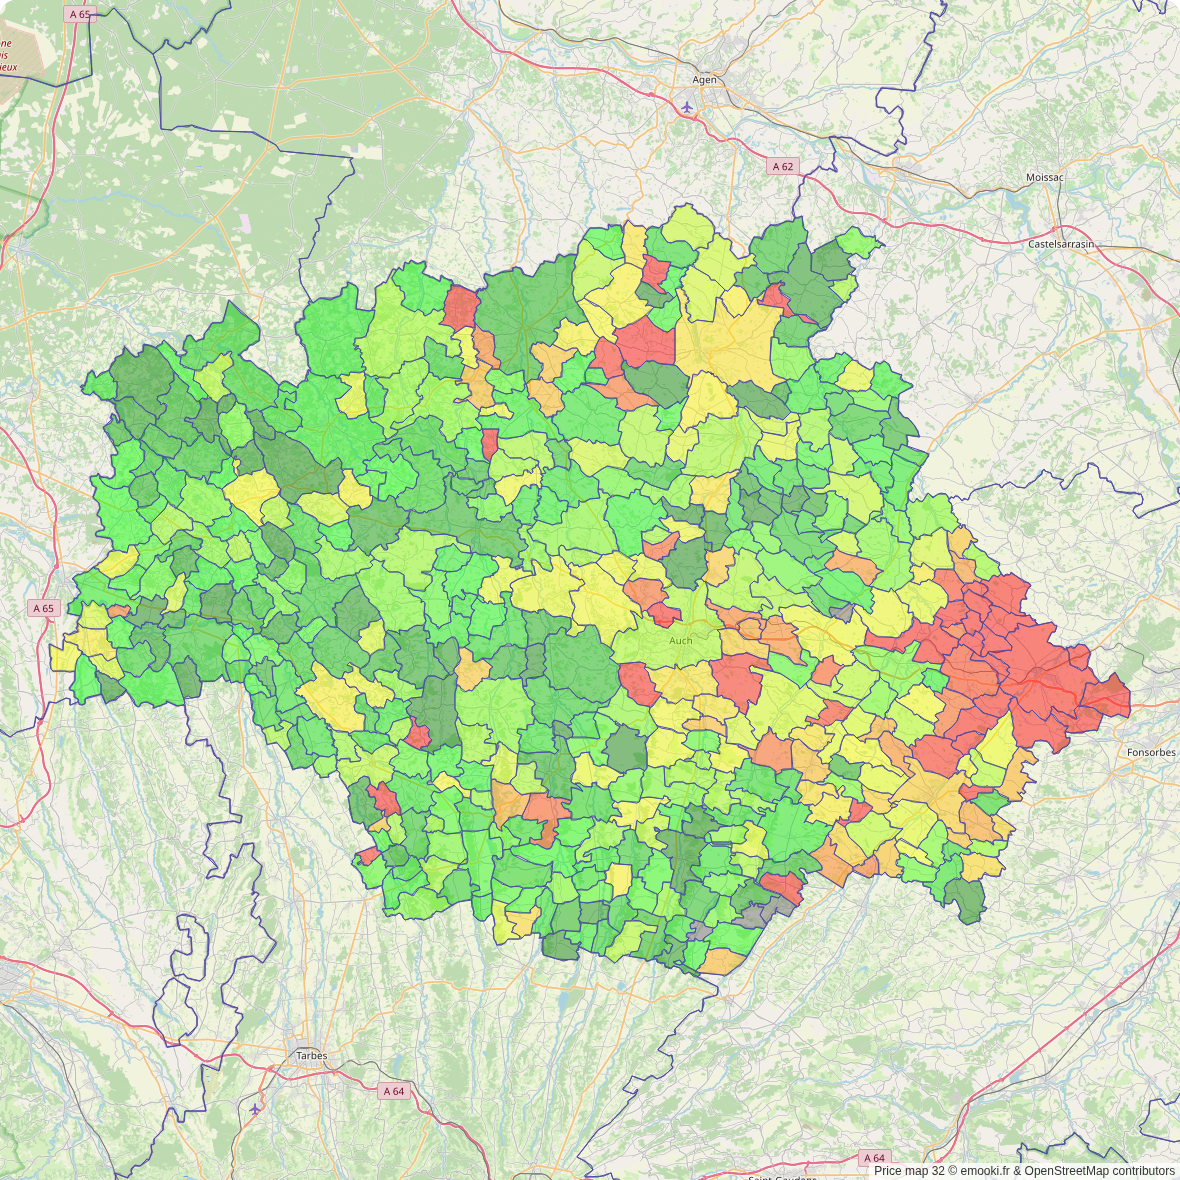
Median price of real estate
in the Gers department

HousesHouses
1 537 € /m²
1-23-45-67-89-10
Reliability 10/10
Median price on the 352 transactions of the last 3 months.
from 927 to
2 142 € /m²
60% of transactions from the 2nd to the 8th deciles.
ApartmentsApartments
1 472 € /m²
1-23-45-67-89-10
Reliability 9/10
Median price on the 183 transactions of the last 6 months.
from 968 to
1 908 € /m²
60% of transactions from the 2nd to the 8th deciles.
DwellingsDwellings
1 538 € /m²
1-23-45-67-89-10
Reliability 10/10
Median price on the 437 transactions of the last 3 months.
from 932 to
2 133 € /m²
60% of transactions from the 2nd to the 8th deciles.
HousesEvolution of the price per m² of houses since...
1 year
+4.1%
2 years
+1.7%
3 years
+2.2%
4 years
+11%
5 years
+19%
6 years
+20%
7 years
+28%
8 years
+31%
9 years
+28%
10 years
+25%
11 years
+23%
ApartmentsEvolution of the price per m² of apartments since...
1 year
-5.8%
2 years
-3.7%
3 years
+2.5%
4 years
+9%
5 years
+11%
6 years
+19%
7 years
+17%
8 years
+16%
9 years
+21%
10 years
+30%
11 years
+37%

Yearly evolution

Evolution of the median price per m²

Evolution of the number of transactions

Warning, last year incomplete. Projections made based on the proportions between semesters of the previous year at the departmental/national level and by type of property.

Yearly data

Descending order
Year
Houses
house
transactions
Houses
house
Price per m²
Apartments
apt.
transactions
Apartments
apt.
Price per m²
2025
851
1 581 €
183
1 472 €
2024
1 895
1 519 €
350
1 563 €
2023
2 187
1 554 €
450
1 528 €
2022
2 881
1 547 €
549
1 436 €
2021
3 128
1 424 €
517
1 351 €
2020
2 368
1 326 €
434
1 328 €
2019
2 382
1 313 €
417
1 239 €
2018
2 106
1 234 €
314
1 263 €
2017
2 185
1 205 €
334
1 266 €
2016
1 857
1 238 €
288
1 213 €
2015
1 727
1 261 €
219
1 129 €
2014
1 511
1 285 €
247
1 078 €

Analysis

Structure of prices per m²

Values of price percentiles per m² over the periods used for the estimated price of each type of property.

Structure of transaction amounts

Values of transaction amounts percentiles over the periods used for the estimated price of each type of property.

Transaction amounts and prices per m² by percentile

Ascending order
Percentile
Houses
house
Price per m²
Houses
house
Transaction amount
Apartments
apt.
Price per m²
Apartments
apt.
Transaction amount
10th percentile
567 €
51 230 €
780 €
39 000 €
20th percentile
927 €
77 180 €
968 €
47 906 €
30th percentile
1 102 €
112 K€
1 125 €
59 812 €
40th percentile
1 302 €
132 K€
1 305 €
70 000 €
50th percentile
1 537 €
150 K€
1 472 €
80 000 €
60th percentile
1 667 €
173 K€
1 594 €
92 760 €
70th percentile
1 875 €
214 K€
1 741 €
106 K€
80th percentile
2 142 €
263 K€
1 908 €
130 K€
90th percentile
2 448 €
330 K€
2 295 €
165 K€

Quarterly evolution

Evolution of the median price per m²

Evolution of the number of transactions

Quarterly data

Descending order
Quarter
Houses
house
transactions
Houses
house
Price per m²
Apartments
apt.
transactions
Apartments
apt.
Price per m²
2025 Q2
352
1 537 €
85
1 552 €
2025 Q1
499
1 618 €
98
1 356 €
2024 Q4
519
1 492 €
99
1 574 €
2024 Q3
517
1 561 €
92
1 484 €
2024 Q2
432
1 500 €
93
1 603 €
2024 Q1
427
1 519 €
66
1 588 €
2023 Q4
528
1 571 €
104
1 554 €
2023 Q3
535
1 588 €
119
1 542 €
2023 Q2
556
1 514 €
116
1 528 €
2023 Q1
568
1 542 €
111
1 514 €
2022 Q4
687
1 600 €
153
1 458 €
2022 Q3
821
1 631 €
137
1 429 €
2022 Q2
725
1 500 €
138
1 462 €
2022 Q1
648
1 462 €
121
1 405 €
2021 Q4
811
1 441 €
134
1 350 €
2021 Q3
881
1 493 €
127
1 415 €
2021 Q2
790
1 402 €
137
1 385 €
2021 Q1
646
1 333 €
119
1 283 €
2020 Q4
823
1 351 €
137
1 333 €
2020 Q3
561
1 431 €
94
1 343 €
2020 Q2
483
1 263 €
101
1 354 €
2020 Q1
501
1 283 €
102
1 312 €
2019 Q4
655
1 344 €
109
1 189 €
2019 Q3
664
1 329 €
115
1 224 €
2019 Q2
533
1 257 €
108
1 320 €
2019 Q1
530
1 292 €
85
1 233 €
2018 Q4
578
1 284 €
72
1 263 €
2018 Q3
579
1 260 €
90
1 312 €
2018 Q2
472
1 207 €
87
1 208 €
2018 Q1
477
1 176 €
65
1 170 €
2017 Q4
577
1 192 €
79
1 299 €
2017 Q3
589
1 216 €
84
1 291 €
2017 Q2
560
1 196 €
90
1 224 €
2017 Q1
459
1 216 €
81
1 220 €
2016 Q4
491
1 243 €
72
1 189 €
2016 Q3
528
1 263 €
76
1 254 €
2016 Q2
447
1 231 €
80
1 223 €
2016 Q1
391
1 233 €
60
1 172 €
2015 Q4
498
1 324 €
46
1 138 €
2015 Q3
504
1 256 €
64
1 181 €
2015 Q2
399
1 221 €
51
1 036 €
2015 Q1
326
1 221 €
58
1 130 €
2014 Q4
393
1 178 €
54
1 194 €
2014 Q3
431
1 384 €
82
915 €
2014 Q2
340
1 289 €
51
1 176 €
2014 Q1
347
1 269 €
60
1 006 €

Gers (32)

Most expensive cities

City
name
Descending orderHouses
house
Price per m²
3 642 €
3 004 €
2 776 €
2 714 €
2 706 €
2 624 €
2 589 €
2 554 €
2 525 €
2 380 €
City
name
Descending orderApartments
apt.
Price per m²
4 815 €
3 138 €
2 784 €
2 359 €
2 283 €
1 954 €
1 885 €
1 722 €
1 718 €
1 710 €

Least expensive cities

City
name
Ascending orderHouses
house
Price per m²
593 €
619 €
625 €
716 €
730 €
780 €
796 €
805 €
813 €
822 €
City
name
Ascending orderApartments
apt.
Price per m²
297 €
316 €
341 €
381 €
422 €
425 €
430 €
460 €
464 €
488 €