Median price of real estate
in the municipality of Montastruc-la-Conseillère
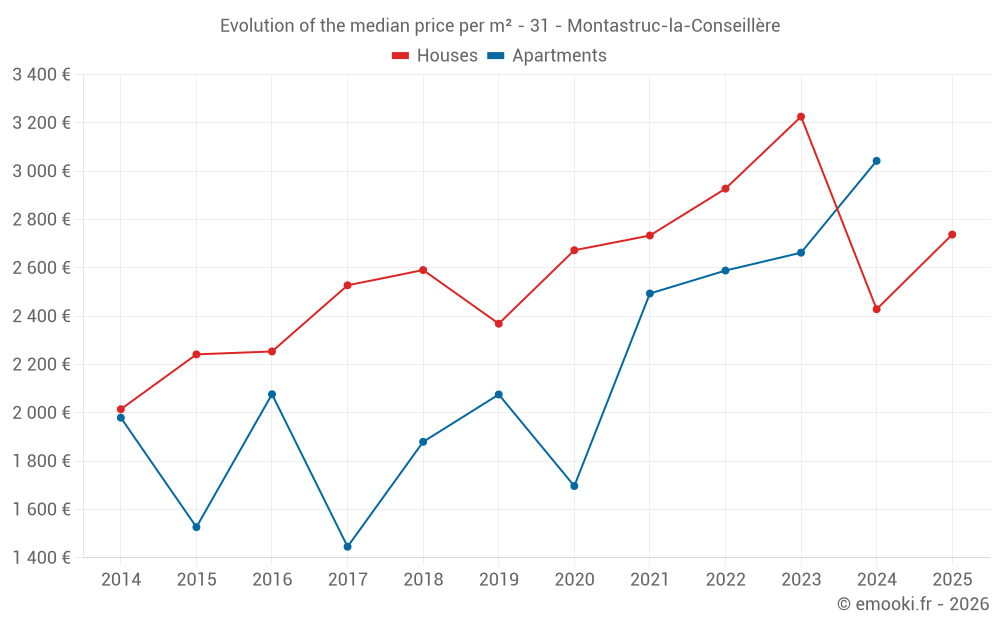
Houses
2 602 € /m²
Reliability 8/10
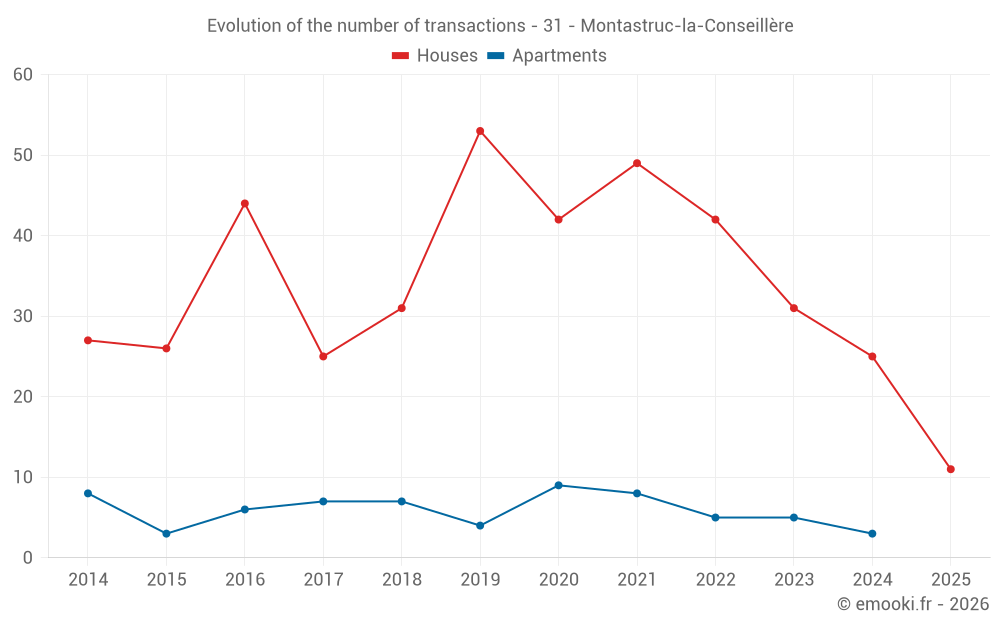
Median price on the 23 transactions of the last 12 months.
from 1 955 to
3 195 € /m²
3 195 € /m²
60% of transactions from the 2nd to the 8th deciles.
Apartments
2 607 € /m²
Reliability 5/10
Median price on the 18 transactions of the last 48 months.
from 2 273 to
3 026 € /m²
3 026 € /m²
60% of transactions from the 2nd to the 8th deciles.
Dwellings
2 626 € /m²
Reliability 8/10
Median price on the 24 transactions of the last 12 months.
from 1 963 to
3 183 € /m²
3 183 € /m²
60% of transactions from the 2nd to the 8th deciles.