emooki
HomePrice mapTransactions
🇬🇧 English🇫🇷 Français🇩🇪 Deutsch🇪🇸 Español🇮🇹 Italiano

Real estate price map


Real estate price map in the municipality of Avignonet-Lauragais, choose a section to see transactions by parcel.

Haute-Garonne (31)

Avignonet-Lauragais - Real estate price m²

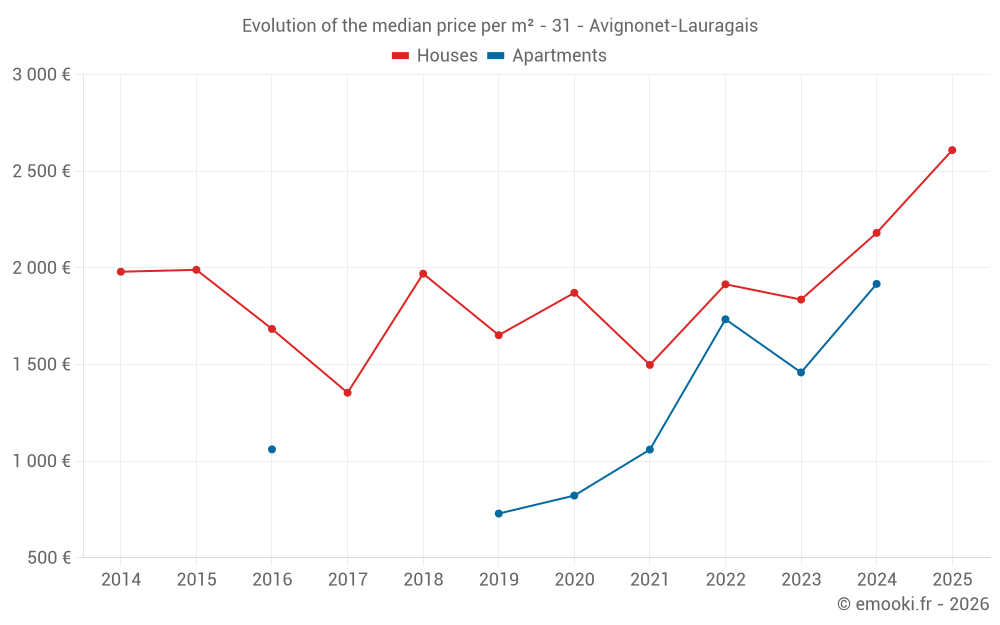
Median price of real estate
in the municipality of Avignonet-Lauragais

HousesHouses
2 063  /m²
1-23-45-67-89-10
Reliability 7/10
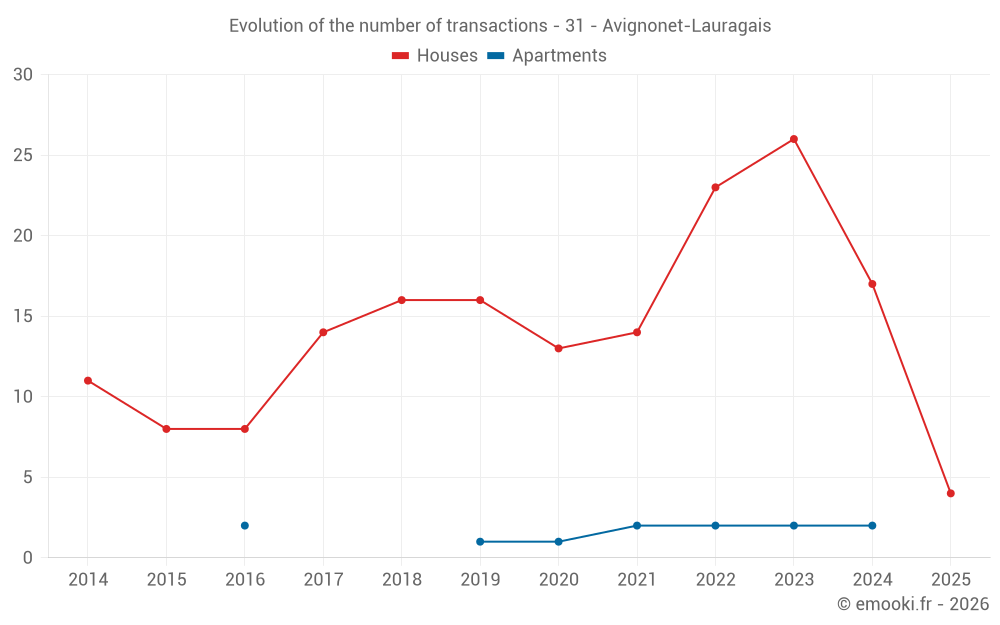
Median price on the 35 transactions of the last 24 months.
from 1 425 to
2 707  /m²
60% of transactions from the 2nd to the 8th deciles.
ApartmentsApartments
1 742  /m²
1-23-45-67-89-10
Reliability 4/10
Median price on the 9 transactions of the last 60 months.
DwellingsDwellings
2 001  /m²
1-23-45-67-89-10
Reliability 7/10
Median price on the 38 transactions of the last 24 months.
from 1 384 to
2 670  /m²
60% of transactions from the 2nd to the 8th deciles.
HousesEvolution of the price per m² of houses since...
1 year
+20%
2 years
+42%
3 years
+36%
4 years
+74%
5 years
+39%
6 years
+58%
7 years
+32%
8 years
+93%
9 years
+55%
10 years
+31%
11 years
+32%

Yearly evolution

Evolution of the median price per m²

Evolution of the median price per m² - 31 - Avignonet-Lauragais

Evolution of the number of transactions

Warning, last year incomplete. Projections made based on the proportions between semesters of the previous year at the departmental/national level and by type of property.

Evolution of the number of transactions - 31 - Avignonet-Lauragais

Yearly data

Descending order
Year
Houses
house
transactions
Houses
house
Price per m²
Apartments
apt.
transactions
Apartments
apt.
Price per m²
2025
4
2 609 
0
--- 
2024
17
2 181 
2
1 917 
2023
26
1 836 
2
1 459 
2022
23
1 915 
2
1 734 
2021
14
1 498 
2
1 060 
2020
13
1 871 
1
822 
2019
16
1 652 
1
729 
2018
16
1 970 
0
--- 
2017
14
1 354 
0
--- 
2016
8
1 684 
2
1 061 
2015
8
1 990 
0
--- 
2014
11
1 980 
0
--- 

Analysis

Structure of prices per m²

Values of price percentiles per m² over the periods used for the estimated price of each type of property.

Structure of transaction amounts

Values of transaction amounts percentiles over the periods used for the estimated price of each type of property.

Transaction amounts and prices per m² by percentile

Ascending order
Percentile
Houses
house
Price per m²
Houses
house
Transaction amount
Apartments
apt.
Price per m²
Apartments
apt.
Transaction amount
10th percentile
1 206 
100 K
730 
105 K
20th percentile
1 425 
117 K
875 
107 K
30th percentile
1 644 
138 K
1 017 
111 K
40th percentile
1 950 
154 K
1 289 
116 K
50th percentile
2 063 
212 K
1 742 
120 K
60th percentile
2 262 
232 K
1 756 
128 K
70th percentile
2 451 
276 K
1 815 
150 K
80th percentile
2 707 
322 K
1 904 
165 K
90th percentile
2 857 
363 K
2 096 
175 K

National and departmental comparison

Evolution of the median price per m² of houses

Evolution of the median price per m² of apartments

Quarterly evolution

Evolution of the median price per m²

Evolution of the number of transactions

Quarterly data

Descending order
Quarter
Houses
house
transactions
Houses
house
Price per m²
Apartments
apt.
transactions
Apartments
apt.
Price per m²
2025 Q1
4
2 609 
0
--- 
2024 Q4
3
2 561 
0
--- 
2024 Q3
5
2 273 
1
1 981 
2024 Q2
3
2 782 
1
1 853 
2024 Q1
6
1 409 
0
--- 
2023 Q4
6
1 736 
0
--- 
2023 Q3
8
1 516 
1
1 176 
2023 Q2
7
1 845 
0
--- 
2023 Q1
5
1 952 
1
1 742 
2022 Q4
7
2 123 
0
--- 
2022 Q3
4
1 915 
1
911 
2022 Q2
6
1 830 
1
2 556 
2022 Q1
6
1 503 
0
--- 
2021 Q4
2
1 226 
1
360 
2021 Q3
6
1 602 
1
1 759 
2021 Q2
3
2 500 
0
--- 
2021 Q1
3
708 
0
--- 
2020 Q4
4
1 915 
1
822 
2020 Q3
5
1 871 
0
--- 
2020 Q2
2
2 270 
0
--- 
2020 Q1
2
1 321 
0
--- 
2019 Q4
4
2 094 
0
--- 
2019 Q3
7
2 081 
1
729 
2019 Q2
4
1 336 
0
--- 
2019 Q1
1
1 661 
0
--- 
2018 Q4
4
1 590 
0
--- 
2018 Q3
3
1 846 
0
--- 
2018 Q2
1
1 900 
0
--- 
2018 Q1
8
2 142 
0
--- 
2017 Q4
4
1 614 
0
--- 
2017 Q3
2
2 132 
0
--- 
2017 Q2
5
1 324 
0
--- 
2017 Q1
3
1 165 
0
--- 
2016 Q4
1
1 302 
0
--- 
2016 Q3
2
1 984 
0
--- 
2016 Q2
3
2 232 
0
--- 
2016 Q1
2
1 132 
2
1 061 
2015 Q4
3
1 941 
0
--- 
2015 Q3
4
2 062 
0
--- 
2015 Q1
1
897 
0
--- 
2014 Q4
4
1 366 
0
--- 
2014 Q3
6
2 026 
0
--- 
2014 Q1
1
2 200 
0
--- 

Overview of the latest real estate transactions

The following list is an anonymized overview of the latest transactions. For more details and to find all transactions, please use the map to view transactions by plot or the transaction search page for a search by criteria.

2025-05-05
8 000 
Exchange
Land
552 m2
-Terres
2025-05-05
1 000 
9  /m²(106 m²)
Exchange
Houses
House
5 rooms
106 m2
1 outbuilding
2025-04-30
10 000 
Sale
Land
145 m2
-Jardins
2025-04-10
54 000 
Sale
Land
258 m2
-Sols
2025-03-31
278 100 
2 483  /m²(112 m²)
Sale
Houses
House
6 rooms
112 m2
Land
2000 m2
-Terrains d'agrément
/Parc
Land
500 m2
-Sols
2025-03-04
120 000 
1 967  /m²(61 m²)
Sale
Houses
House
3 rooms
61 m2
Land
356 m2
-Sols
2025-02-26
50 000 
Sale
1 outbuilding
Land
207 m2
-Sols
2025-02-15
4 270 
Sale
Land
1840 m2
-Landes
Land
2430 m2
-Terres
2025-02-05
282 250 
2 823  /m²(100 m²)
Sale
Houses
House
3 rooms
100 m2
1 outbuilding
Land
537 m2
-Sols
2025-01-16
355 500 
2 735  /m²(130 m²)
Sale
Houses
House
5 rooms
130 m2
1 outbuilding
Land
600 m2
-Terrains d'agrément
/Parc
Land
700 m2
-Sols
Land
195 m2
-Jardins
2024-12-30
368 800 
2 561  /m²(144 m²)
Sale
Houses
House
5 rooms
144 m2
Land
4285 m2
-Terrains d'agrément
/Parc
Land
3500 m2
-Sols
2024-12-20
302 000 
2 626  /m²(115 m²)
Sale
Houses
House
5 rooms
115 m2
Land
785 m2
-Sols
2024-12-11
225 000 
Sale
Land
1602 m2
-Terrains d'agrément
/Parc
Land
1000 m2
-Sols
2024-11-12
201 900 
2 321  /m²(87 m²)
Sale
Houses
House
3 rooms
87 m2
Land
790 m2
-Sols
Land
133 m2
-Sols
2024-10-22
50 800 
Sale
Land
2243 m2
-Terres
2024-09-18
225 000 
2 273  /m²(99 m²)
Sale
Houses
House
5 rooms
99 m2
Land
1261 m2
-Sols
2024-08-29
270 000 
2 700  /m²(100 m²)
Sale
Houses
House
2 rooms
100 m2
2 outbuildings
2024-08-29
414 850 
Sale
Land
10618 m2
-Terres
Land
11371 m2
-Terres
2024-07-31
337 230 
2 279  /m²(148 m²)
Sale
Houses
House
3 rooms
148 m2
Land
396 m2
-Sols
2024-07-19
107 000 
1 981  /m²(54 m²)
Sale
Apartments
Apartment
3 rooms
54 m2
2 outbuildings
344 transactions listed in the municipality

Haute-Garonne (31)

Most expensive cities

City
name
Descending orderHouses
house
Price per m²
3 998 
3 940 
3 830 
3 818 
3 782 
3 738 
3 698 
3 676 
3 617 
City
name
Descending orderApartments
apt.
Price per m²
5 212 
3 780 
3 396 
3 384 
3 358 
3 260 
3 252 

Least expensive cities

City
name
Ascending orderHouses
house
Price per m²
594 
756 
794 
795 
825 
City
name
Ascending orderApartments
apt.
Price per m²
202 
212 
230 
278 
294