Real estate price map
Real estate price map in the municipality of Corscia, choose a section to see transactions by parcel.
Haute-Corse (2B)
Price per m² in Corscia
Median price of real estate
in the municipality of Corscia
Houses
957 € /m²
Reliability 3/10
Median price on the 6 transactions of the last 72 months.
Apartments
500 € /m²
Reliability 4/10
Median price on the 9 transactions of the last 60 months.
Dwellings
724 € /m²
Reliability 4/10
Median price on the 12 transactions of the last 60 months.
from 500 to
988 € /m²
988 € /m²
60% of transactions from the 2nd to the 8th deciles.
Yearly evolution
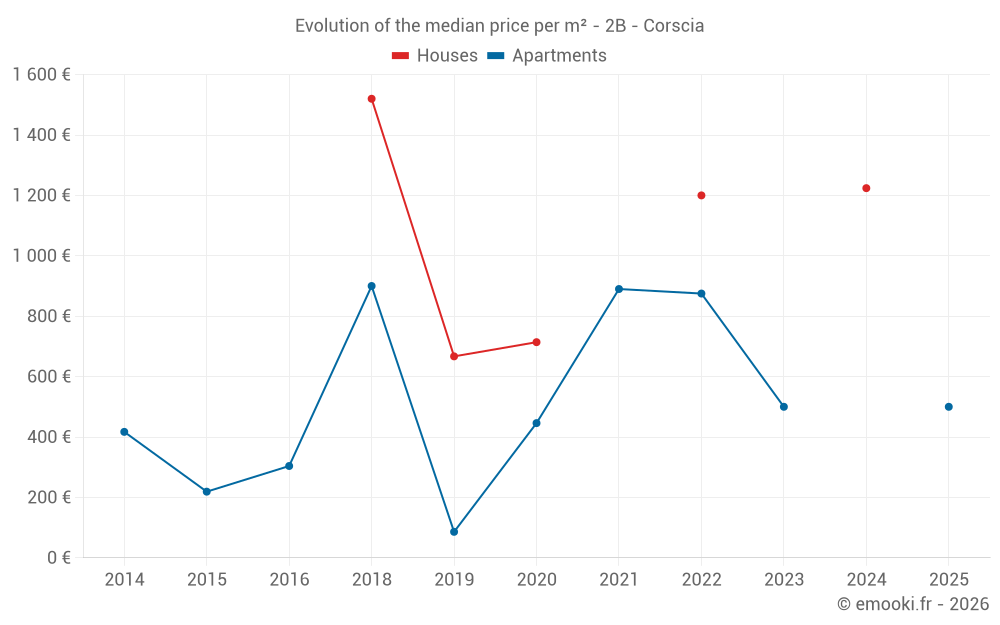
Evolution of the median price per m²
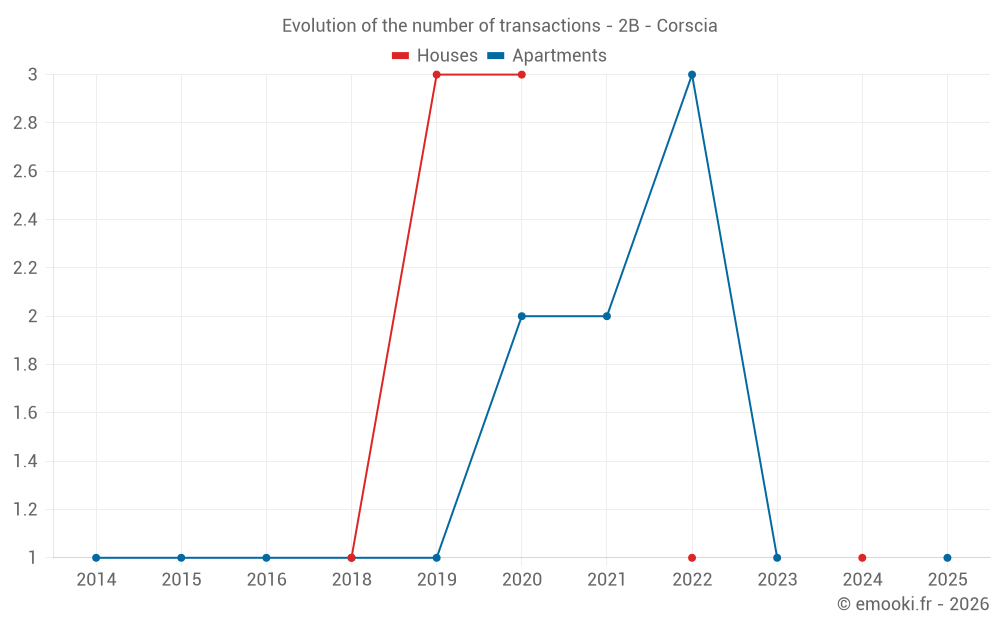
Evolution of the number of transactions
Warning, last year incomplete.
Yearly data
Year
house
transactions
transactions
house
Price per m²
Price per m²
apt.
transactions
transactions
apt.
Price per m²
Price per m²
2025
0
--- €
1
500 €
2024
1
1 224 €
0
--- €
2023
0
--- €
1
500 €
2022
1
1 200 €
3
875 €
2021
0
--- €
2
890 €
2020
3
714 €
2
446 €
2019
3
667 €
1
86 €
2018
1
1 520 €
1
900 €
2017
0
--- €
0
--- €
2016
0
--- €
1
304 €
2015
0
--- €
1
219 €
2014
0
--- €
1
417 €
Analysis
Structure of prices per m²
Values of price percentiles per m² over the periods used for the estimated price of each type of property.
Structure of transaction amounts
Values of transaction amounts percentiles over the periods used for the estimated price of each type of property.
Transaction amounts and prices per m² by percentile
Percentile
house
Price per m²
Price per m²
house
Transaction amount
Transaction amount
apt.
Price per m²
Price per m²
apt.
Transaction amount
Transaction amount
10th percentile
660 €
33 000 €
344 €
10 100 €
20th percentile
667 €
50 000 €
456 €
13 200 €
30th percentile
690 €
60 000 €
500 €
16 400 €
40th percentile
714 €
70 000 €
500 €
21 000 €
50th percentile
957 €
95 000 €
500 €
25 000 €
60th percentile
1 200 €
120 K€
725 €
29 000 €
70th percentile
1 212 €
135 K€
837 €
42 000 €
80th percentile
1 224 €
150 K€
900 €
50 000 €
90th percentile
1 862 €
219 K€
950 €
52 400 €
National and departmental comparison
Evolution of the median price per m² of houses
Evolution of the median price per m² of apartments
Quarterly evolution
Evolution of the median price per m²
Evolution of the number of transactions
Quarterly data
Quarter
house
transactions
transactions
house
Price per m²
Price per m²
apt.
transactions
transactions
apt.
Price per m²
Price per m²
2025 Q2
0
--- €
1
500 €
2024 Q1
1
1 224 €
0
--- €
2023 Q2
0
--- €
1
500 €
2022 Q4
1
1 200 €
1
938 €
2022 Q2
0
--- €
2
516 €
2021 Q3
0
--- €
1
781 €
2021 Q2
0
--- €
1
1 000 €
2020 Q4
1
667 €
2
446 €
2020 Q2
2
1 607 €
0
--- €
2019 Q4
1
654 €
0
--- €
2019 Q2
1
667 €
0
--- €
2019 Q1
1
1 190 €
1
86 €
2018 Q2
0
--- €
1
900 €
2018 Q1
1
1 520 €
0
--- €
2016 Q1
0
--- €
1
304 €
2015 Q4
0
--- €
1
219 €
2014 Q1
0
--- €
1
417 €
Overview of the latest real estate transactions
The following list is an anonymized overview of the latest transactions. For more details and to find all transactions, please use the map to view transactions by plot or the transaction search page for a search by criteria.
2025-05-28
50 000 €500 € /m²(100 m²)
Sale
Apartment
3 rooms
100 m2
2 outbuildings
Land
61 m2
-Jardins
Land
27 m2
-Sols
2025-04-15
2 500 €Exchange
Land
25517 m2
-Terres
Land
2202 m2
-Vergers
/CHAT
Land
8208 m2
-Vergers
/CHAT
Land
224 m2
-Vergers
/Noyeraie ou noyers
2025-04-15
1 000 €Exchange
Land
104 m2
-Terres
Land
224 m2
-Vergers
/Noyeraie ou noyers
Land
277 m2
-Terres
2025-04-10
10 000 €Exchange
Land
28098 m2
-Terres
Land
800 m2
-Terrains à bâtir
2024-10-15
50 000 €Sale
Land
209 m2
-Jardins
2024-10-10
25 000 €Exchange
Land
719 m2
-Terres
Land
800 m2
-Terres
Land
216 m2
-Sols
2024-08-20
500 €Sale
Land
3120 m2
-Vignes
2024-05-04
2 000 €Sale
Land
2197 m2
-Terres
2024-04-30
6 676 €Sale
Land
604 m2
-Landes
/Friche
Land
37347 m2
-Landes
/Friche
Land
168 m2
-Jardins
2024-03-14
120 000 €1 224 € /m²(98 m²)
Sale
House
3 rooms
98 m2
Land
458 m2
-Sols
Land
185 m2
-Jardins
Land
118 m2
-Terres
Land
225 m2
-Terres
2024-01-30
22 000 €Sale
Land
2007 m2
-Terres
2023-10-23
1 200 €Sale
Land
297 m2
-Jardins
2023-06-28
300 €Sale
Land
753 m2
-Vignes
Land
198 m2
-Landes
/Friche
2023-06-28
12 000 €500 € /m²(24 m²)
Sale
Apartment
24 m2
1 outbuilding
Land
789 m2
-Vignes
2023-05-09
9 747 €Sale
Land
713 m2
-Landes
/Friche
Land
988 m2
-Vergers
/CHAT
Land
2382 m2
-Taillis simples
/Chênes -verts
Land
137 m2
-Jardins
Land
385 m2
-Landes
/Friche
Land
56787 m2
-Landes
/Friche
2023-05-09
3 193 €Sale
Land
3077 m2
-Terres
Land
23534 m2
-Landes
/Friche
2022-12-08
30 000 €938 € /m²(32 m²)
Sale
Apartment
1 room
32 m2
2022-10-11
287 935 €1 200 € /m²(240 m²)
Sale
House
7 rooms
240 m2
Land
188 m2
-Sols
Land
1045 m2
-Terres
2022-08-31
40 000 €Sale
Land
23 m2
-Landes
/Friche
2022-08-01
500 €Sale
Land
393 m2
-Jardins
Land
65 m2
-Jardins
65 transactions listed in the municipality
Compare with neighboring municipalities
City
name
name
house
Price per m²
Price per m²
apt.
Price per m²
Price per m²
City information
Zip code
- 20224 CORSCIA
Data source & update
- Latest publication of the property value request (DVF) database made available by the DGFiP on October 19, 2025, covering transactions up to 06/30/2025:
- Administrative/cadastral division as of September 1, 2025, and municipal movements as of January 1, 2025: