emooki
HomePrice mapTransactions
🇬🇧 English🇫🇷 Français🇩🇪 Deutsch🇪🇸 Español🇮🇹 Italiano

Real estate price map


Real estate price map in the municipality of Castellare-di-Casinca, choose a section to see transactions by parcel.

Haute-Corse (2B)

Castellare-di-Casinca - Real estate price m²

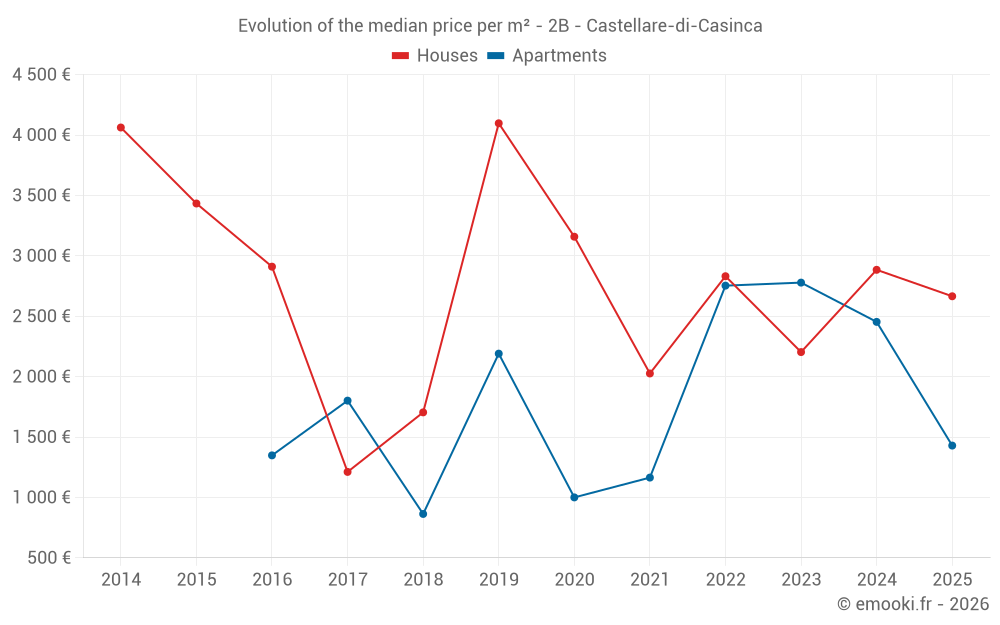
Median price of real estate
in the municipality of Castellare-di-Casinca

HousesHouses
2 806  /m²
1-23-45-67-89-10
Reliability 5/10
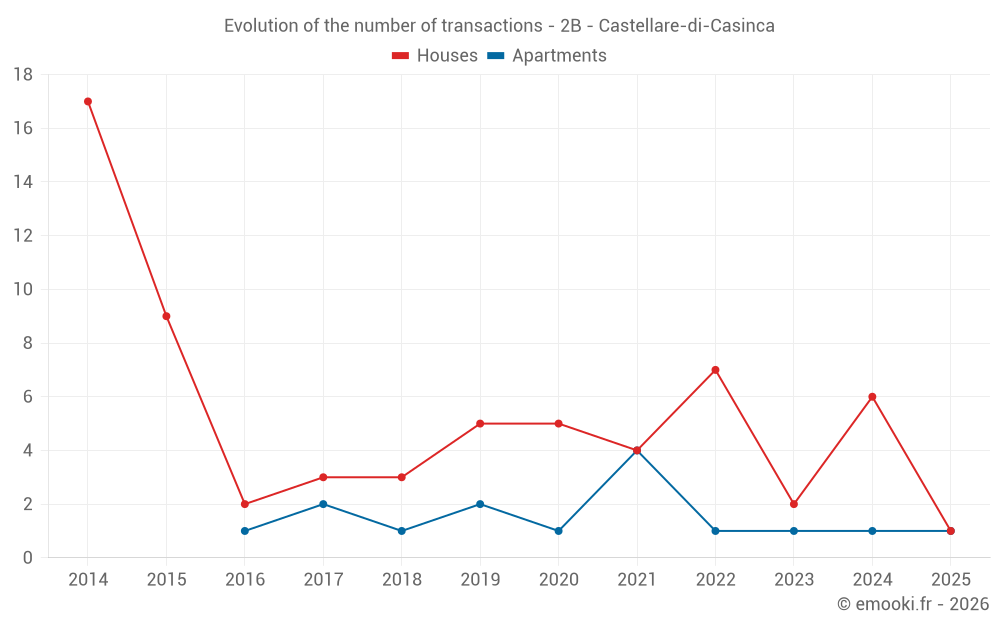
Median price on the 17 transactions of the last 48 months.
from 1 926 to
3 347  /m²
60% of transactions from the 2nd to the 8th deciles.
ApartmentsApartments
1 429  /m²
1-23-45-67-89-10
Reliability 4/10
Median price on the 9 transactions of the last 60 months.
DwellingsDwellings
2 656  /m²
1-23-45-67-89-10
Reliability 6/10
Median price on the 15 transactions of the last 36 months.
from 1 686 to
2 918  /m²
60% of transactions from the 2nd to the 8th deciles.

Yearly evolution

Evolution of the median price per m²

Evolution of the median price per m² - 2B - Castellare-di-Casinca

Evolution of the number of transactions

Warning, last year incomplete. Projections made based on the proportions between semesters of the previous year at the departmental/national level and by type of property.

Evolution of the number of transactions - 2B - Castellare-di-Casinca

Yearly data

Descending order
Year
Houses
house
transactions
Houses
house
Price per m²
Apartments
apt.
transactions
Apartments
apt.
Price per m²
2025
1
2 665 
1
1 429 
2024
6
2 884 
1
2 453 
2023
2
2 203 
1
2 778 
2022
7
2 831 
1
2 753 
2021
4
2 026 
4
1 164 
2020
5
3 158 
1
1 000 
2019
5
4 097 
2
2 190 
2018
3
1 704 
1
863 
2017
3
1 211 
2
1 801 
2016
2
2 910 
1
1 348 
2015
9
3 433 
0
--- 
2014
17
4 062 
0
--- 

Analysis

Structure of prices per m²

Values of price percentiles per m² over the periods used for the estimated price of each type of property.

Structure of transaction amounts

Values of transaction amounts percentiles over the periods used for the estimated price of each type of property.

Transaction amounts and prices per m² by percentile

Ascending order
Percentile
Houses
house
Price per m²
Houses
house
Transaction amount
Apartments
apt.
Price per m²
Apartments
apt.
Transaction amount
10th percentile
1 572 
72 200 
950 
39 200 
20th percentile
1 926 
93 000 
1 017 
52 000 
30th percentile
2 562 
117 K
1 137 
60 000 
40th percentile
2 660 
255 K
1 325 
74 000 
50th percentile
2 806 
303 K
1 429 
130 K
60th percentile
2 874 
326 K
1 998 
186 K
70th percentile
3 282 
382 K
2 328 
207 K
80th percentile
3 347 
407 K
2 573 
213 K
90th percentile
3 854 
420 K
2 758 
235 K

National and departmental comparison

Evolution of the median price per m² of houses

Evolution of the median price per m² of apartments

Quarterly evolution

Evolution of the median price per m²

Evolution of the number of transactions

Quarterly data

Descending order
Quarter
Houses
house
transactions
Houses
house
Price per m²
Apartments
apt.
transactions
Apartments
apt.
Price per m²
2025 Q2
1
2 665 
0
--- 
2025 Q1
0
--- 
1
1 429 
2024 Q4
1
4 278 
0
--- 
2024 Q3
3
3 268 
0
--- 
2024 Q2
2
1 794 
1
2 453 
2023 Q3
0
--- 
1
2 778 
2023 Q1
2
2 203 
0
--- 
2022 Q3
2
2 704 
1
2 753 
2022 Q2
2
3 120 
0
--- 
2022 Q1
3
2 806 
0
--- 
2021 Q4
0
--- 
1
750 
2021 Q3
1
3 350 
0
--- 
2021 Q2
2
2 026 
1
1 299 
2021 Q1
1
855 
2
1 584 
2020 Q4
0
--- 
1
1 000 
2020 Q3
1
2 264 
0
--- 
2020 Q2
2
3 442 
0
--- 
2020 Q1
2
2 230 
0
--- 
2019 Q4
2
4 392 
1
1 519 
2019 Q2
1
5 750 
1
2 860 
2019 Q1
2
1 794 
0
--- 
2018 Q3
3
1 704 
0
--- 
2018 Q1
0
--- 
1
863 
2017 Q4
0
--- 
1
1 863 
2017 Q3
1
1 211 
1
1 739 
2017 Q2
1
1 360 
0
--- 
2017 Q1
1
483 
0
--- 
2016 Q4
1
2 202 
1
1 348 
2016 Q1
1
3 618 
0
--- 
2015 Q4
2
2 740 
0
--- 
2015 Q3
1
3 424 
0
--- 
2015 Q2
3
3 433 
0
--- 
2015 Q1
3
3 447 
0
--- 
2014 Q4
7
3 441 
0
--- 
2014 Q3
6
4 932 
0
--- 
2014 Q2
3
3 561 
0
--- 
2014 Q1
1
4 926 
0
--- 

Overview of the latest real estate transactions

The following list is an anonymized overview of the latest transactions. For more details and to find all transactions, please use the map to view transactions by plot or the transaction search page for a search by criteria.

2025-06-05
410 435 
2 665  /m²(154 m²)
Sale
Houses
House
5 rooms
154 m2
1 outbuilding
Land
1080 m2
-Terres
2025-03-31
40 000 
1 429  /m²(28 m²)
Sale
Apartments
Apartment
2 rooms
28 m2
2025-01-29
50 000 
Sale
Land
21 m2
-Landes
/Friche
2024-12-12
393 531 
4 278  /m²(92 m²)
Sale
Houses
House
3 rooms
92 m2
1 outbuilding
Land
1818 m2
-Sols
Land
202 m2
-Terres
2024-08-26
303 000 
5 050  /m²(60 m²)
Sale
Houses
House
3 rooms
60 m2
Land
1204 m2
-Sols
2024-08-26
120 000 
1 304  /m²(92 m²)
Sale
Houses
House
4 rooms
92 m2
Land
69 m2
-Sols
2024-07-24
500 000 
3 268  /m²(153 m²)
Sale
Houses
House
4 rooms
153 m2
1 outbuilding
Land
998 m2
-Vergers
Land
68 m2
-Vergers
Land
3 m2
-Sols
2024-07-11
5 000 
Sale
Land
1157 m2
-Terres
Land
843 m2
-Terres
2024-06-28
50 000 
1 087  /m²(46 m²)
Sale
Houses
House
2 rooms
46 m2
Land
301 m2
-Bois
/Maquis
2024-06-28
13 000 
Sale
Land
2069 m2
-Bois
/Maquis
2024-06-26
45 000 
2 500  /m²(18 m²)
Sale
Houses
House
1 room
18 m2
2024-05-28
810 
Sale
Land
270 m2
-Sols
2024-05-16
190 000 
Sale
Land
1129 m2
-Bois
/Maquis
Land
2180 m2
-Taillis simples
/Chênes -verts
Land
737 m2
-Taillis simples
/Chênes -verts
2024-05-14
130 000 
2 453  /m²(53 m²)
Sale
Apartments
Apartment
2 rooms
53 m2
Land
17 m2
-Landes
/Friche
2024-04-18
60 000 
Sale
Land
29441 m2
-Terres
2024-03-20
3 000 
Sale
Land
6820 m2
-Bois
/Maquis
2023-12-19
1 520 
Sale
Land
76 m2
-Vergers
/CHAT
2023-08-31
70 000 
946  /m²(74 m²)
1 129  /m²(62 m²)
Sale
Houses
House
6 rooms
62 m2
Commercial property
12 m2
Land
62 m2
-Sols
2023-08-31
20 000 
Sale
Land
7600 m2
-Vignes
2023-08-18
600 
Exchange
Land
3930 m2
-Terres
Land
4583 m2
-Landes
/Friche
182 transactions listed in the municipality

Haute-Corse (2B)

Most expensive cities

City
name
Descending orderHouses
house
Price per m²
7 772 
7 333 
6 630 
6 175 
5 710 
5 390 
5 342 
5 244 
5 167 
5 030 
City
name
Descending orderApartments
apt.
Price per m²
7 500 
5 113 
5 112 
4 848 
4 833 
4 476 
4 406 
4 390 
4 108 

Least expensive cities

City
name
Ascending orderHouses
house
Price per m²
136 
306 
364 
396 
500 
514 
528 
560 
City
name
Ascending orderApartments
apt.
Price per m²
33 
75 
100 
114 
120 
151 
192 
196 
200 
272