emooki
HomePrice mapTransactions
🇬🇧 English🇫🇷 Français🇩🇪 Deutsch🇪🇸 Español🇮🇹 Italiano

Real estate price map


Real estate price map in the municipality of Les Villages Vovéens, choose a section to see transactions by parcel.

Eure-et-Loir (28)
Les Villages Vovéens

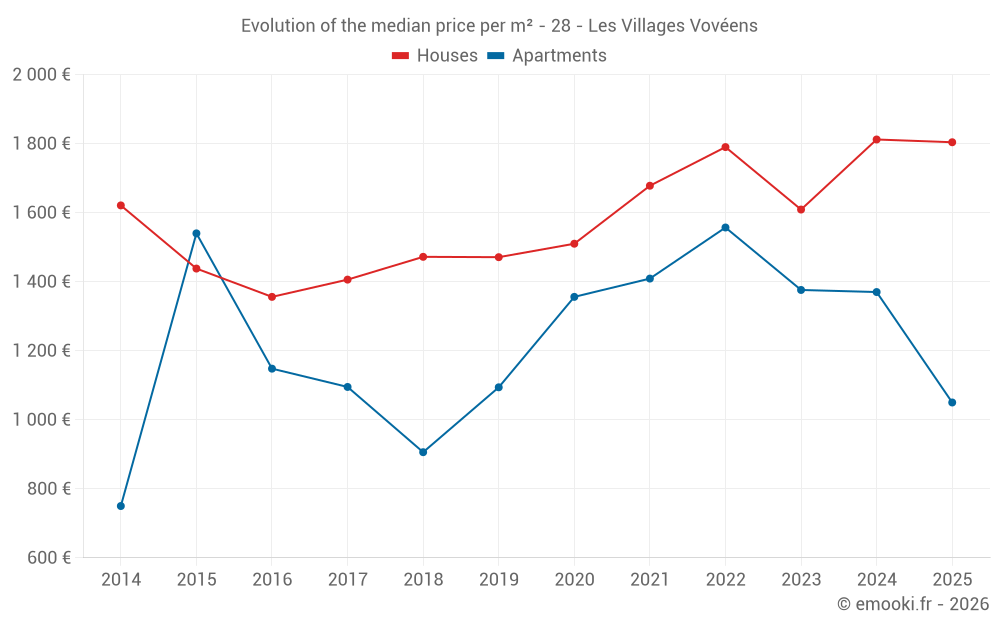
Median price of real estate
in the municipality of Les Villages Vovéens

HousesHouses
1 784  /m²
1-23-45-67-89-10
Reliability 8/10
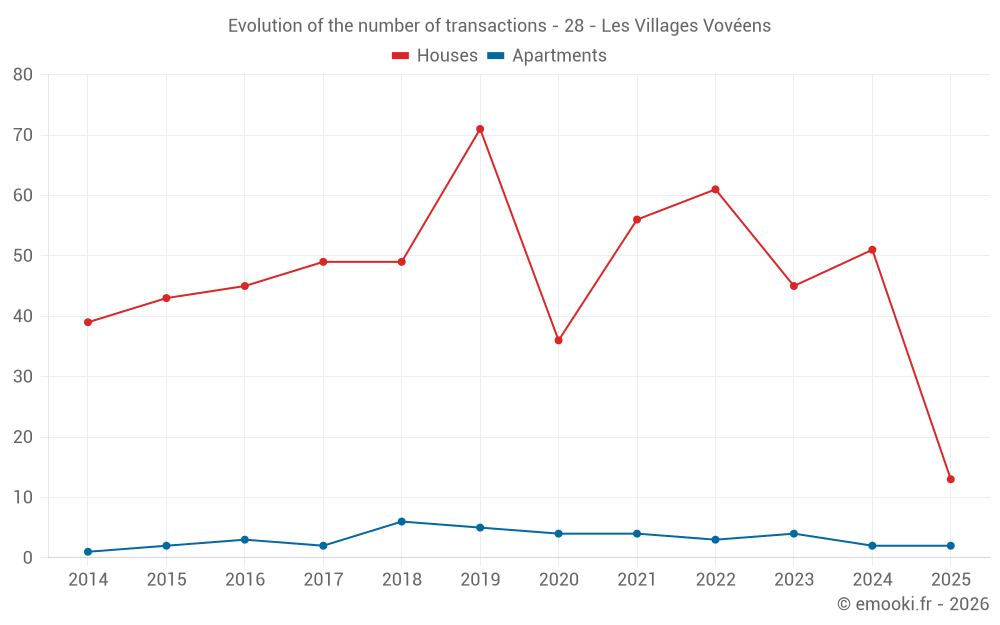
Median price on the 40 transactions of the last 12 months.
from 1 171 to
1 958  /m²
60% of transactions from the 2nd to the 8th deciles.
ApartmentsApartments
1 296  /m²
1-23-45-67-89-10
Reliability 5/10
Median price on the 14 transactions of the last 48 months.
from 960 to
1 728  /m²
60% of transactions from the 2nd to the 8th deciles.
DwellingsDwellings
1 747  /m²
1-23-45-67-89-10
Reliability 8/10
Median price on the 43 transactions of the last 12 months.
from 1 127 to
1 947  /m²
60% of transactions from the 2nd to the 8th deciles.
HousesEvolution of the price per m² of houses since...
1 year
-0.4%
2 years
+12%
3 years
+0.8%
4 years
+7.5%
5 years
+19%
6 years
+23%
7 years
+23%
8 years
+28%
9 years
+33%
10 years
+25%
11 years
+11%
The price per m² of houses has decreased by 0.4% since 1 year, but it has increased by 33% in 9 years.

Yearly evolution

Evolution of the median price per m²

Evolution of the number of transactions

Warning, last year incomplete. Projections made based on the proportions between semesters of the previous year at the departmental/national level and by type of property.

Yearly data

Descending order
Year
Houses
house
transactions
Houses
house
Price per m²
Apartments
apt.
transactions
Apartments
apt.
Price per m²
2025
13
1 804 
2
1 050 
2024
51
1 812 
2
1 370 
2023
45
1 609 
4
1 376 
2022
61
1 790 
3
1 557 
2021
56
1 678 
4
1 409 
2020
36
1 510 
4
1 356 
2019
71
1 471 
5
1 094 
2018
49
1 472 
6
906 
2017
49
1 406 
2
1 095 
2016
45
1 356 
3
1 148 
2015
43
1 438 
2
1 540 
2014
39
1 621 
1
750 

Analysis

Structure of prices per m²

Values of price percentiles per m² over the periods used for the estimated price of each type of property.

Structure of transaction amounts

Values of transaction amounts percentiles over the periods used for the estimated price of each type of property.

Transaction amounts and prices per m² by percentile

Ascending order
Percentile
Houses
house
Price per m²
Houses
house
Transaction amount
Apartments
apt.
Price per m²
Apartments
apt.
Transaction amount
10th percentile
1 066 
72 700 
830 
37 200 
20th percentile
1 171 
92 000 
960 
46 000 
30th percentile
1 531 
129 K
1 034 
54 500 
40th percentile
1 632 
143 K
1 127 
60 300 
50th percentile
1 784 
150 K
1 296 
62 750 
60th percentile
1 807 
162 K
1 531 
75 520 
70th percentile
1 923 
169 K
1 590 
80 000 
80th percentile
1 958 
179 K
1 728 
80 160 
90th percentile
2 143 
244 K
1 798 
90 620 

National and departmental comparison

Evolution of the median price per m² of houses

Evolution of the median price per m² of apartments

Quarterly evolution

Evolution of the median price per m²

Evolution of the number of transactions

Quarterly data

Descending order
Quarter
Houses
house
transactions
Houses
house
Price per m²
Apartments
apt.
transactions
Apartments
apt.
Price per m²
2025 Q2
4
1 806 
0
--- 
2025 Q1
9
1 793 
2
1 050 
2024 Q4
14
1 548 
0
--- 
2024 Q3
13
1 819 
1
1 164 
2024 Q2
12
1 912 
1
1 576 
2024 Q1
12
1 838 
0
--- 
2023 Q4
9
1 571 
0
--- 
2023 Q3
13
1 899 
0
--- 
2023 Q2
11
1 475 
3
1 714 
2023 Q1
12
1 663 
1
800 
2022 Q4
22
1 824 
0
--- 
2022 Q3
14
1 880 
1
1 118 
2022 Q2
14
1 740 
2
1 778 
2022 Q1
11
1 622 
0
--- 
2021 Q4
16
1 857 
3
1 000 
2021 Q3
17
1 503 
0
--- 
2021 Q2
6
1 731 
1
1 833 
2021 Q1
17
1 377 
0
--- 
2020 Q4
9
1 799 
0
--- 
2020 Q3
10
1 306 
0
--- 
2020 Q2
6
1 730 
2
1 803 
2020 Q1
11
1 561 
2
1 087 
2019 Q4
19
1 471 
1
1 094 
2019 Q3
17
1 500 
2
1 462 
2019 Q2
22
1 372 
0
--- 
2019 Q1
13
1 527 
2
644 
2018 Q4
16
1 506 
0
--- 
2018 Q3
13
1 316 
3
875 
2018 Q2
12
1 506 
1
457 
2018 Q1
8
1 507 
2
1 481 
2017 Q4
11
1 390 
0
--- 
2017 Q3
14
1 497 
0
--- 
2017 Q2
14
1 428 
1
1 000 
2017 Q1
10
1 358 
1
1 190 
2016 Q4
14
1 364 
0
--- 
2016 Q3
16
1 526 
1
1 148 
2016 Q2
9
1 222 
2
1 044 
2016 Q1
6
1 219 
0
--- 
2015 Q4
8
1 499 
0
--- 
2015 Q3
9
1 340 
0
--- 
2015 Q2
19
1 465 
0
--- 
2015 Q1
7
1 189 
2
1 540 
2014 Q4
14
1 450 
0
--- 
2014 Q3
9
1 670 
0
--- 
2014 Q2
8
1 607 
0
--- 
2014 Q1
8
1 428 
1
750 

Overview of the latest real estate transactions

The following list is an anonymized overview of the latest transactions. For more details and to find all transactions, please use the map to view transactions by plot or the transaction search page for a search by criteria.

2025-06-27
258 000 
2 529  /m²(102 m²)
Sale
Houses
House
4 rooms
102 m2
Land
494 m2
-Sols
Land
15 m2
-Sols
2025-06-19
85 000 
Sale
Land
1633 m2
-Jardins
2025-06-10
162 360 
1 804  /m²(90 m²)
Sale
Houses
House
4 rooms
90 m2
Land
438 m2
-Sols
2025-05-27
47 600 
Sale
Land
49 m2
-Sols
Land
479 m2
-Terrains à bâtir
2025-05-24
46 600 
Sale
Land
498 m2
-Terrains à bâtir
2025-05-22
134 000 
1 634  /m²(82 m²)
Sale
Houses
House
3 rooms
82 m2
1 outbuilding
Land
500 m2
-Sols
2025-05-17
1 053 
Sale
Land
1060 m2
-Taillis simples
Land
1045 m2
-Taillis simples
2025-05-12
132 000 
1 808  /m²(73 m²)
Sale
Houses
House
4 rooms
73 m2
1 outbuilding
Land
493 m2
-Jardins
Land
492 m2
-Sols
2025-04-15
1 060 
Sale
Land
811 m2
-Sols
2025-04-15
22 440 
Sale
Land
630 m2
-Terres
Land
7568 m2
-Sols
Land
366 m2
-Sols
Land
455 m2
-Sols
2025-04-09
27 000 
Sale
Land
3725 m2
-Terres
Land
14900 m2
-Terres
Land
1346 m2
-Terres
Land
5388 m2
-Terres
2025-03-31
150 000 
1 630  /m²(92 m²)
Sale
Houses
House
6 rooms
92 m2
Land
810 m2
-Sols
2025-03-27
2 895 
Sale
Land
1110 m2
-Terres
Land
1212 m2
-Terres
Land
1699 m2
-Terres
2025-03-25
195 000 
2 635  /m²(74 m²)
Sale
Houses
House
5 rooms
74 m2
Land
563 m2
-Sols
Land
1066 m2
-Taillis sous futaie
2025-03-24
49 100 
Sale
Land
475 m2
-Terrains à bâtir
2025-03-21
80 000 
1 429  /m²(56 m²)
Sale
Apartments
Apartment
3 rooms
56 m2
2 outbuildings
Land
2400 m2
-Sols
2025-03-12
173 250 
1 925  /m²(90 m²)
Sale
Houses
House
4 rooms
90 m2
Land
484 m2
-Sols
2025-03-12
161 370 
1 793  /m²(90 m²)
Sale
Houses
House
4 rooms
90 m2
Land
480 m2
-Sols
2025-03-10
46 800 
Sale
Land
504 m2
-Terrains à bâtir
2025-02-28
173 000 
1 362  /m²(127 m²)
Sale
Houses
House
5 rooms
127 m2
1 outbuilding
Land
592 m2
-Sols
Land
25 m2
-Sols
977 transactions listed in the municipality

Eure-et-Loir (28)

Most expensive cities

City
name
Descending orderHouses
house
Price per m²
2 917 
2 856 
2 804 
2 766 
2 750 
2 708 
2 669 
2 660 
City
name
Descending orderApartments
apt.
Price per m²
5 298 
2 786 
2 625 
2 608 
2 566 
2 552 
2 532 
2 500 

Least expensive cities

City
name
Ascending orderHouses
house
Price per m²
675 
801 
828 
874 
956 
1 016 
1 047 
City
name
Ascending orderApartments
apt.
Price per m²
220 
404