Real estate price map
Real estate price map in the municipality of Ver-lès-Chartres, choose a section to see transactions by parcel.
Eure-et-Loir (28)
Price per m² in Ver-lès-Chartres
Median price of real estate
in the municipality of Ver-lès-Chartres
Houses
2 240 € /m²
Reliability 6/10
Median price on the 20 transactions of the last 36 months.
from 1 650 to
2 991 € /m²
2 991 € /m²
60% of transactions from the 2nd to the 8th deciles.
Yearly evolution
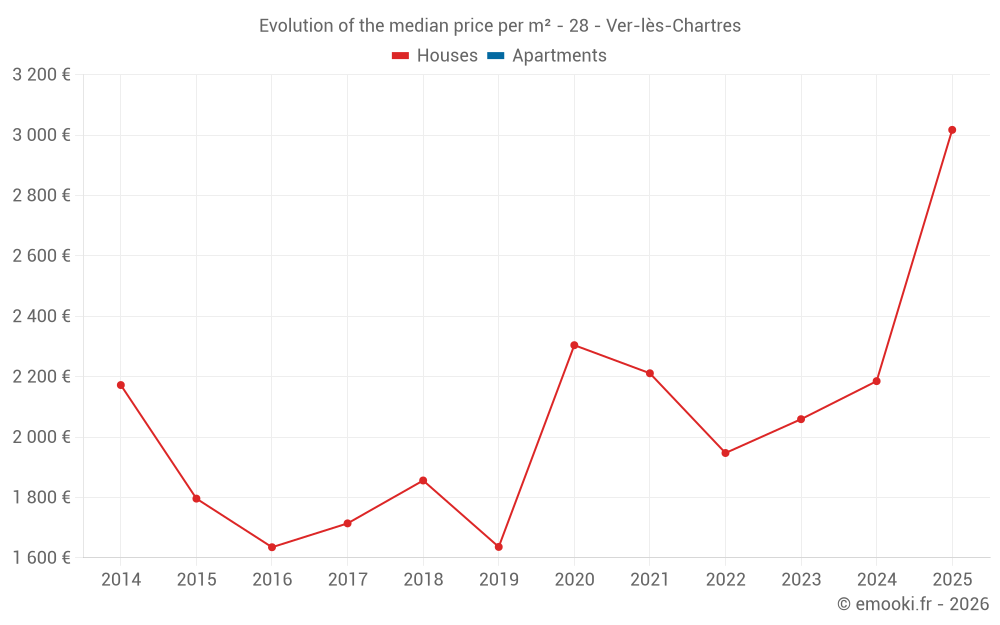
Evolution of the median price per m²
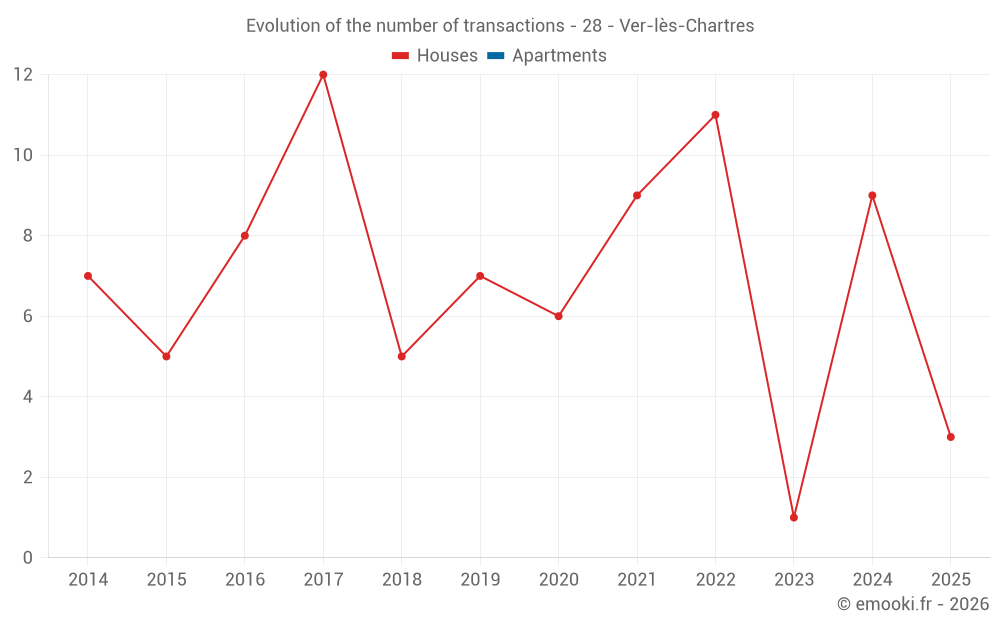
Evolution of the number of transactions
Warning, last year incomplete. Projections made based on the proportions between semesters of the previous year at the departmental/national level and by type of property.
Yearly data
Year
house
transactions
transactions
house
Price per m²
Price per m²
apt.
transactions
transactions
apt.
Price per m²
Price per m²
2025
3
3 017 €
0
--- €
2024
9
2 185 €
0
--- €
2023
1
2 059 €
0
--- €
2022
11
1 947 €
0
--- €
2021
9
2 211 €
0
--- €
2020
6
2 304 €
0
--- €
2019
7
1 636 €
0
--- €
2018
5
1 856 €
0
--- €
2017
12
1 714 €
0
--- €
2016
8
1 635 €
0
--- €
2015
5
1 796 €
0
--- €
2014
7
2 172 €
0
--- €
Analysis
Structure of prices per m²
Values of price percentiles per m² over the periods used for the estimated price of each type of property.
Structure of transaction amounts
Values of transaction amounts percentiles over the periods used for the estimated price of each type of property.
Transaction amounts and prices per m² by percentile
Percentile
house
Price per m²
Price per m²
house
Transaction amount
Transaction amount
apt.
Price per m²
Price per m²
apt.
Transaction amount
Transaction amount
10th percentile
1 453 €
177 K€
--- €
--- €
20th percentile
1 650 €
196 K€
--- €
--- €
30th percentile
1 938 €
209 K€
--- €
--- €
40th percentile
2 044 €
252 K€
--- €
--- €
50th percentile
2 240 €
308 K€
--- €
--- €
60th percentile
2 478 €
336 K€
--- €
--- €
70th percentile
2 739 €
393 K€
--- €
--- €
80th percentile
2 991 €
407 K€
--- €
--- €
90th percentile
3 095 €
463 K€
--- €
--- €
National and departmental comparison
Evolution of the median price per m² of houses
Evolution of the median price per m² of apartments
Quarterly evolution
Evolution of the median price per m²
Evolution of the number of transactions
Quarterly data
Quarter
house
transactions
transactions
house
Price per m²
Price per m²
apt.
transactions
transactions
apt.
Price per m²
Price per m²
2025 Q1
3
3 017 €
0
--- €
2024 Q4
3
2 022 €
0
--- €
2024 Q2
4
2 378 €
0
--- €
2024 Q1
2
2 308 €
0
--- €
2023 Q2
1
2 059 €
0
--- €
2022 Q4
3
2 417 €
0
--- €
2022 Q3
4
1 786 €
0
--- €
2022 Q2
2
1 970 €
0
--- €
2022 Q1
2
2 204 €
0
--- €
2021 Q4
4
2 888 €
0
--- €
2021 Q3
2
2 236 €
0
--- €
2021 Q2
2
1 994 €
0
--- €
2021 Q1
1
1 355 €
0
--- €
2020 Q3
1
1 959 €
0
--- €
2020 Q2
2
2 304 €
0
--- €
2020 Q1
3
2 528 €
0
--- €
2019 Q4
2
1 597 €
0
--- €
2019 Q3
1
3 101 €
0
--- €
2019 Q2
1
1 933 €
0
--- €
2019 Q1
3
1 250 €
0
--- €
2018 Q4
2
1 632 €
0
--- €
2018 Q3
1
2 456 €
0
--- €
2018 Q2
1
1 856 €
0
--- €
2018 Q1
1
1 278 €
0
--- €
2017 Q4
4
1 605 €
0
--- €
2017 Q3
5
1 944 €
0
--- €
2017 Q2
2
1 688 €
0
--- €
2017 Q1
1
1 027 €
0
--- €
2016 Q4
4
2 129 €
0
--- €
2016 Q3
2
1 041 €
0
--- €
2016 Q2
2
1 502 €
0
--- €
2015 Q4
1
2 158 €
0
--- €
2015 Q2
3
1 670 €
0
--- €
2015 Q1
1
1 796 €
0
--- €
2014 Q4
2
1 972 €
0
--- €
2014 Q3
1
2 493 €
0
--- €
2014 Q2
3
2 172 €
0
--- €
2014 Q1
1
2 220 €
0
--- €
Overview of the latest real estate transactions
The following list is an anonymized overview of the latest transactions. For more details and to find all transactions, please use the map to view transactions by plot or the transaction search page for a search by criteria.
2025-06-23
6 000 €Sale
Land
621 m2
-Terres
2025-03-24
94 500 €Sale
Land
2483 m2
-Taillis simples
2025-03-17
1 €Sale
Land
47 m2
-Sols
2025-03-07
324 200 €3 088 € /m²(105 m²)
Sale
House
3 rooms
105 m2
1 outbuilding
Land
1218 m2
-Sols
2025-02-25
200 000 €2 985 € /m²(67 m²)
Sale
House
4 rooms
67 m2
1 outbuilding
Land
820 m2
-Sols
2025-02-12
392 200 €3 017 € /m²(130 m²)
Sale
House
8 rooms
130 m2
Land
601 m2
-Sols
Land
848 m2
-Jardins
2024-11-15
180 000 €1 636 € /m²(110 m²)
Sale
House
5 rooms
110 m2
Land
1165 m2
-Sols
2024-10-25
400 000 €2 667 € /m²(150 m²)
Sale
House
4 rooms
150 m2
1 outbuilding
Land
1009 m2
-Sols
2024-10-11
180 000 €2 022 € /m²(89 m²)
Sale
House
5 rooms
89 m2
Land
642 m2
-Sols
2024-09-23
4 000 €Sale
Land
6189 m2
-Terres
Land
1523 m2
-Terres
2024-08-02
15 112 €Sale
Land
959 m2
-Terres
2024-06-29
354 000 €2 185 € /m²(162 m²)
Sale
House
6 rooms
162 m2
Land
861 m2
-Sols
2024-06-20
436 000 €2 907 € /m²(150 m²)
Sale
House
5 rooms
150 m2
1 outbuilding
Land
1489 m2
-Terrains d'agrément
Land
918 m2
-Sols
2024-05-03
323 800 €2 570 € /m²(126 m²)
Sale
House
5 rooms
126 m2
Land
942 m2
-Sols
Land
1327 m2
-Terrains d'agrément
2024-04-27
150 000 €1 250 € /m²(120 m²)
Sale
House
6 rooms
120 m2
Land
1003 m2
-Sols
2024-04-19
28 000 €Sale
Land
3929 m2
-Taillis simples
2024-03-12
821 €Sale
Land
283 m2
-Taillis simples
Land
1770 m2
-Taillis simples
2024-03-12
2 102 €Sale
Land
1038 m2
-Taillis simples
Land
400 m2
-Taillis simples
Land
1830 m2
-Taillis simples
Land
594 m2
-Taillis simples
Land
1399 m2
-Taillis simples
Land
480 m2
-Taillis simples
2024-02-27
150 000 €1 327 € /m²(113 m²)
Sale
House
6 rooms
113 m2
Land
267 m2
-Sols
Land
498 m2
-Sols
2024-02-23
480 000 €3 288 € /m²(146 m²)
Sale
House
4 rooms
146 m2
2 outbuildings
Land
981 m2
-Jardins
Land
914 m2
-Sols
159 transactions listed in the municipality
Compare with neighboring municipalities
City
name
name
house
Price per m²
Price per m²
apt.
Price per m²
Price per m²
City information
Zip code
- 28630 VER LES CHARTRES
Data source & update
- Latest publication of the property value request (DVF) database made available by the DGFiP on October 19, 2025, covering transactions up to 06/30/2025:
- Administrative/cadastral division as of September 1, 2025, and municipal movements as of January 1, 2025: