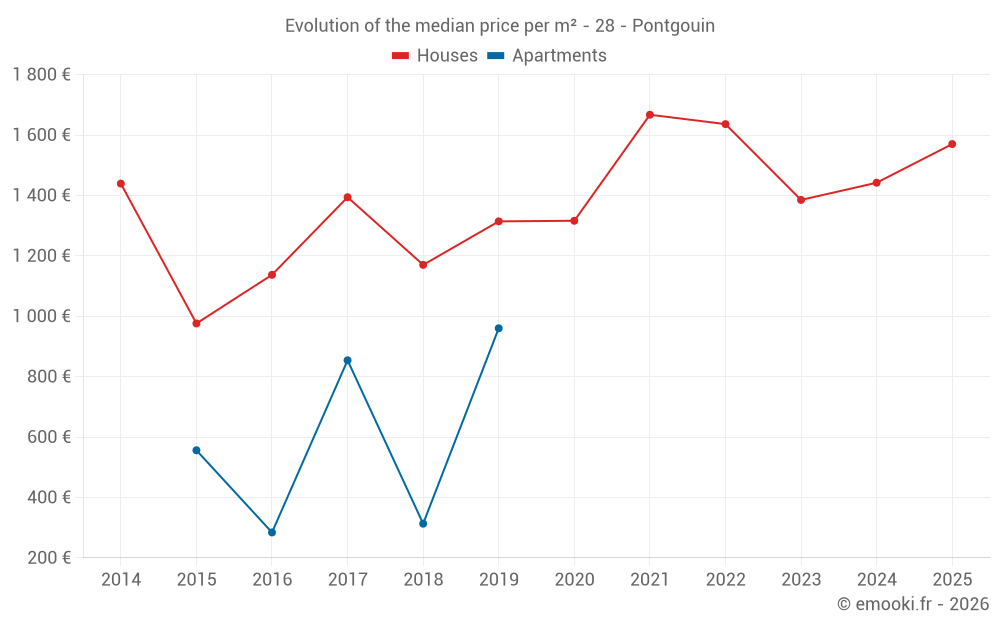
Median price of real estate
in the municipality of Pontgouin
Houses
1 374 € /m²
Reliability 7/10
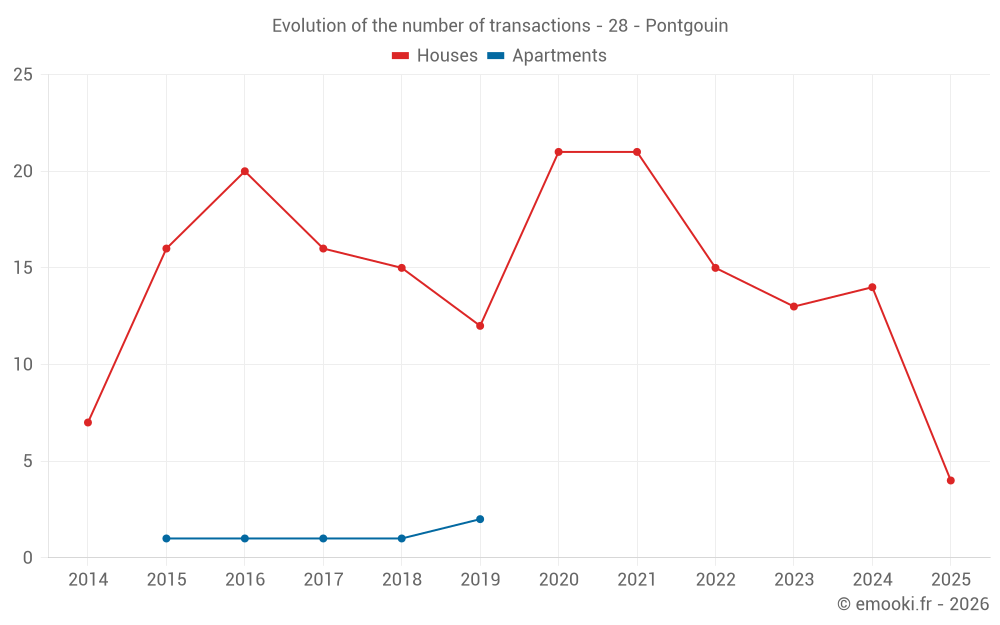
Median price on the 24 transactions of the last 24 months.
from 1 032 to
1 915 € /m²
1 915 € /m²
60% of transactions from the 2nd to the 8th deciles.
Apartments
808 € /m²
Reliability 2/10
Median price on the 4 transactions of the last 96 months.
Dwellings
1 374 € /m²
Reliability 7/10
Median price on the 24 transactions of the last 24 months.
from 1 032 to
1 915 € /m²
1 915 € /m²
60% of transactions from the 2nd to the 8th deciles.