emooki
HomePrice mapTransactions
🇬🇧 English🇫🇷 Français🇩🇪 Deutsch🇪🇸 Español🇮🇹 Italiano

Real estate price map


Real estate price map in the municipality of Châteaudun, choose a section to see transactions by parcel.

Eure-et-Loir (28)
Châteaudun

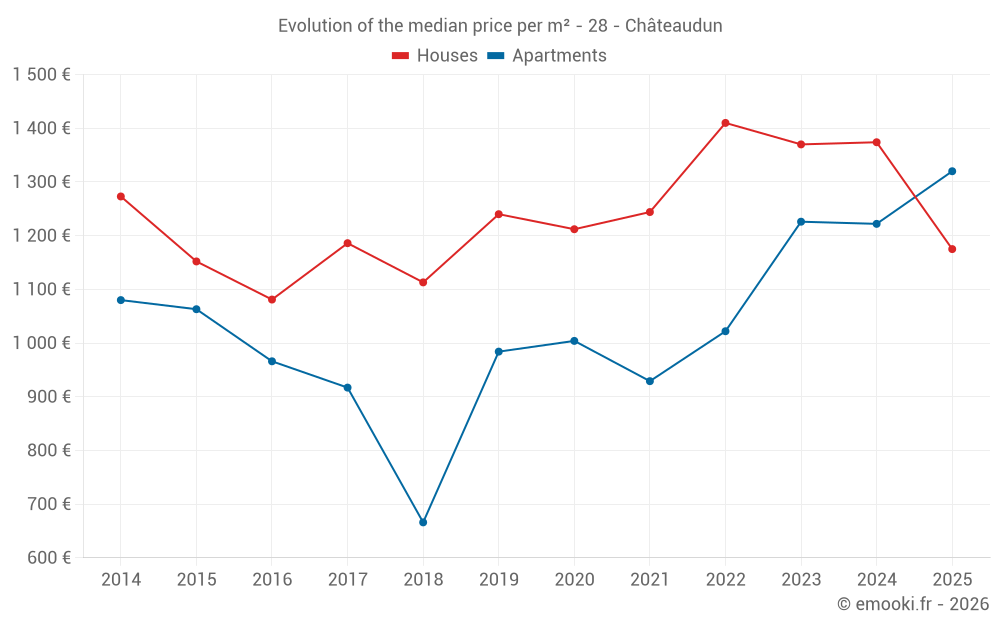
Median price of real estate
in the municipality of Châteaudun

HousesHouses
1 175  /m²
1-23-45-67-89-10
Reliability 9/10
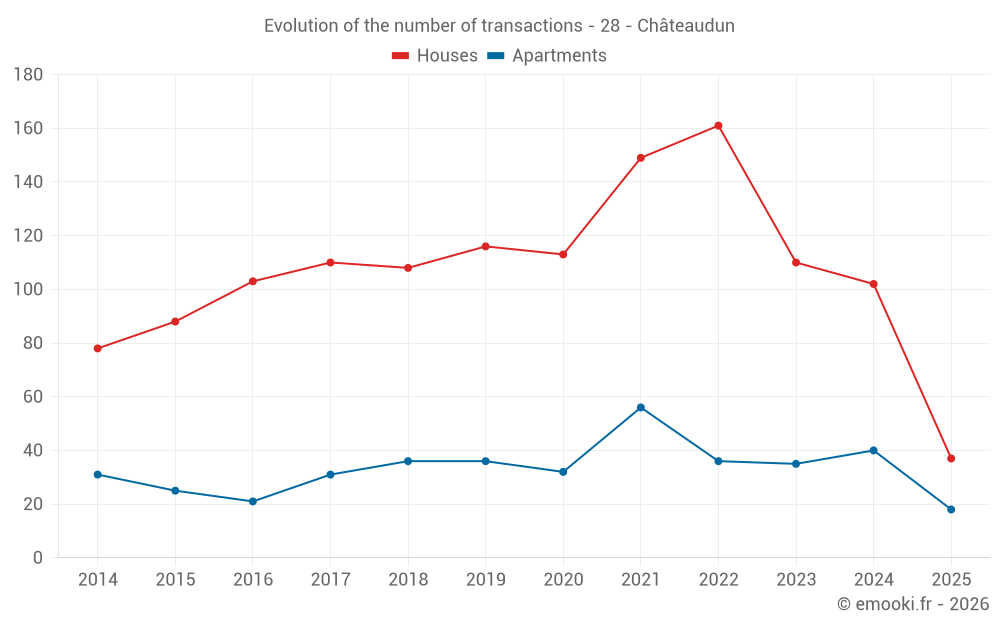
Median price on the 37 transactions of the last 6 months.
from 920 to
1 618  /m²
60% of transactions from the 2nd to the 8th deciles.
ApartmentsApartments
1 320  /m²
1-23-45-67-89-10
Reliability 9/10
Median price on the 18 transactions of the last 6 months.
from 930 to
1 491  /m²
60% of transactions from the 2nd to the 8th deciles.
DwellingsDwellings
1 164  /m²
1-23-45-67-89-10
Reliability 10/10
Median price on the 23 transactions of the last 3 months.
from 1 017 to
1 491  /m²
60% of transactions from the 2nd to the 8th deciles.
HousesEvolution of the price per m² of houses since...
1 year
-14%
2 years
-14%
3 years
-17%
4 years
-5.5%
5 years
-3.1%
6 years
-5.2%
7 years
+5.6%
8 years
-0.9%
9 years
+8.7%
10 years
+2%
11 years
-7.7%
The price per m² of houses has decreased by 17% since 3 years, but it has increased by 8.7% in 9 years.
ApartmentsEvolution of the price per m² of apartments since...
1 year
+8%
2 years
+7.7%
3 years
+29%
4 years
+42%
5 years
+31%
6 years
+34%
7 years
+98%
8 years
+44%
9 years
+37%
10 years
+24%
11 years
+22%

Yearly evolution

Evolution of the median price per m²

Evolution of the median price per m² - 28 - Châteaudun

Evolution of the number of transactions

Warning, last year incomplete. Projections made based on the proportions between semesters of the previous year at the departmental/national level and by type of property.

Evolution of the number of transactions - 28 - Châteaudun

Yearly data

Descending order
Year
Houses
house
transactions
Houses
house
Price per m²
Apartments
apt.
transactions
Apartments
apt.
Price per m²
2025
37
1 175 
18
1 320 
2024
102
1 374 
40
1 222 
2023
110
1 370 
35
1 226 
2022
161
1 410 
36
1 022 
2021
149
1 244 
56
929 
2020
113
1 212 
32
1 004 
2019
116
1 240 
36
984 
2018
108
1 113 
36
666 
2017
110
1 186 
31
917 
2016
103
1 081 
21
966 
2015
88
1 152 
25
1 063 
2014
78
1 273 
31
1 080 

Analysis

Structure of prices per m²

Values of price percentiles per m² over the periods used for the estimated price of each type of property.

Structure of transaction amounts

Values of transaction amounts percentiles over the periods used for the estimated price of each type of property.

Transaction amounts and prices per m² by percentile

Ascending order
Percentile
Houses
house
Price per m²
Houses
house
Transaction amount
Apartments
apt.
Price per m²
Apartments
apt.
Transaction amount
10th percentile
700 
50 400 
641 
38 010 
20th percentile
920 
61 200 
930 
47 000 
30th percentile
1 062 
72 400 
987 
52 550 
40th percentile
1 134 
80 700 
1 043 
59 400 
50th percentile
1 175 
91 595 
1 320 
63 750 
60th percentile
1 282 
100 K
1 383 
69 600 
70th percentile
1 418 
135 K
1 462 
79 213 
80th percentile
1 618 
146 K
1 491 
86 000 
90th percentile
1 818 
163 K
1 680 
108 K

National and departmental comparison

Evolution of the median price per m² of houses

Evolution of the median price per m² of apartments

Quarterly evolution

Evolution of the median price per m²

Evolution of the number of transactions

Quarterly data

Descending order
Quarter
Houses
house
transactions
Houses
house
Price per m²
Apartments
apt.
transactions
Apartments
apt.
Price per m²
2025 Q2
15
1 154 
8
1 430 
2025 Q1
22
1 236 
10
1 152 
2024 Q4
23
1 373 
8
1 174 
2024 Q3
31
1 406 
14
815 
2024 Q2
23
1 322 
9
1 313 
2024 Q1
25
1 441 
9
1 197 
2023 Q4
26
1 229 
6
1 280 
2023 Q3
22
1 428 
5
1 100 
2023 Q2
40
1 358 
7
1 339 
2023 Q1
22
1 372 
17
1 000 
2022 Q4
38
1 456 
10
1 180 
2022 Q3
42
1 441 
12
886 
2022 Q2
41
1 411 
8
747 
2022 Q1
40
1 356 
6
1 145 
2021 Q4
43
1 354 
12
920 
2021 Q3
45
1 244 
12
806 
2021 Q2
30
1 190 
18
1 117 
2021 Q1
31
1 214 
14
913 
2020 Q4
40
1 266 
14
713 
2020 Q3
28
1 022 
3
1 250 
2020 Q2
18
1 413 
8
690 
2020 Q1
27
1 206 
7
1 176 
2019 Q4
32
1 138 
7
703 
2019 Q3
28
1 212 
11
1 087 
2019 Q2
30
1 307 
10
942 
2019 Q1
26
1 277 
8
1 060 
2018 Q4
22
1 240 
9
713 
2018 Q3
22
1 028 
15
725 
2018 Q2
30
1 063 
6
442 
2018 Q1
34
1 104 
6
736 
2017 Q4
23
1 359 
11
624 
2017 Q3
31
1 145 
6
809 
2017 Q2
34
1 180 
7
1 133 
2017 Q1
22
1 069 
7
927 
2016 Q4
26
1 110 
5
1 043 
2016 Q3
24
1 112 
7
761 
2016 Q2
25
1 034 
7
966 
2016 Q1
28
993 
2
441 
2015 Q4
23
1 107 
6
1 086 
2015 Q3
27
1 169 
5
910 
2015 Q2
16
1 110 
9
1 077 
2015 Q1
22
1 166 
5
900 
2014 Q4
23
1 253 
7
1 024 
2014 Q3
14
1 398 
7
1 196 
2014 Q2
26
1 300 
6
918 
2014 Q1
15
1 219 
11
1 156 

Overview of the latest real estate transactions

The following list is an anonymized overview of the latest transactions. For more details and to find all transactions, please use the map to view transactions by plot or the transaction search page for a search by criteria.

2025-06-27
158 000 
854  /m²(185 m²)
1 596  /m²(99 m²)
Sale
Commercial property
86 m2
Land
86 m2
-Sols
Houses
House
4 rooms
99 m2
1 outbuilding
Land
63 m2
-Sols
2025-06-27
64 000 
1 049  /m²(61 m²)
Sale
1 outbuilding
Apartments
Apartment
3 rooms
61 m2
1 outbuilding
2025-06-27
149 000 
887  /m²(168 m²)
Sale
Houses
House
7 rooms
168 m2
Land
334 m2
-Sols
2025-06-26
60 000 
341  /m²(176 m²)
706  /m²(85 m²)
Sale
Apartments
Apartment
4 rooms
85 m2
Commercial property
21 m2
Commercial property
70 m2
2025-06-25
78 500 
1 154  /m²(68 m²)
Sale
Land
9 m2
-Sols
Houses
House
4 rooms
68 m2
Land
145 m2
-Sols
1 outbuilding
Land
18 m2
-Sols
2025-06-25
25 000 
463  /m²(54 m²)
Sale
Apartments
Apartment
3 rooms
54 m2
2 outbuildings
2025-06-18
63 500 
1 477  /m²(43 m²)
Sale
1 outbuilding
Apartments
Apartment
2 rooms
43 m2
1 outbuilding
2025-06-13
97 500 
1 500  /m²(65 m²)
Sale
Houses
House
4 rooms
65 m2
2 outbuildings
Land
1010 m2
-Sols
2025-06-11
70 000 
1 077  /m²(65 m²)
Sale
Houses
House
4 rooms
65 m2
1 outbuilding
Land
424 m2
-Sols
2025-06-10
139 000 
1 904  /m²(73 m²)
Sale
Houses
House
3 rooms
73 m2
1 outbuilding
Land
651 m2
-Sols
2025-06-03
52 500 
1 500  /m²(35 m²)
Sale
Apartments
Apartment
2 rooms
35 m2
1 outbuilding
2025-05-28
6 000 
Sale
1 outbuilding
2025-05-28
76 000 
1 056  /m²(72 m²)
Sale
Houses
House
4 rooms
72 m2
2025-05-27
65 000 
1 327  /m²(49 m²)
Sale
Houses
House
3 rooms
49 m2
Land
53 m2
-Sols
2025-05-23
73 000 
1 043  /m²(70 m²)
Sale
Land
517 m2
-Sols
1 outbuilding
Land
20 m2
-Sols
Houses
House
4 rooms
70 m2
Land
101 m2
-Sols
2025-05-22
3 000 
Sale
Land
338 m2
-Jardins
/Jardin potager
2025-05-19
53 000 
1 710  /m²(31 m²)
Sale
Apartments
Apartment
1 room
31 m2
2 outbuildings
2025-05-14
98 950 
1 124  /m²(88 m²)
Sale
Houses
House
4 rooms
88 m2
1 outbuilding
Land
531 m2
-Sols
2025-05-07
158 000 
1 285  /m²(123 m²)
Sale
Houses
House
5 rooms
123 m2
Land
985 m2
-Sols
2025-04-30
530 000 
231  /m²(2297 m²)
Sale
Commercial property
2297 m2
Land
3589 m2
-Sols
Land
1362 m2
-Sols
Land
194 m2
-Sols
Land
75 m2
-Sols
2351 transactions listed in the municipality

Eure-et-Loir (28)

Most expensive cities

City
name
Descending orderHouses
house
Price per m²
2 917 
2 856 
2 804 
2 766 
2 750 
2 708 
2 669 
2 660 
City
name
Descending orderApartments
apt.
Price per m²
5 298 
2 786 
2 625 
2 608 
2 566 
2 552 
2 532 
2 500 

Least expensive cities

City
name
Ascending orderHouses
house
Price per m²
675 
801 
828 
874 
956 
1 016 
1 047 
City
name
Ascending orderApartments
apt.
Price per m²
220 
404