emooki
HomePrice mapTransactions
🇬🇧 English🇫🇷 Français🇩🇪 Deutsch🇪🇸 Español🇮🇹 Italiano

Real estate price map


Real estate price map in the municipality of Le Manoir, choose a section to see transactions by parcel.

Eure (27)

Le Manoir - Real estate price m²

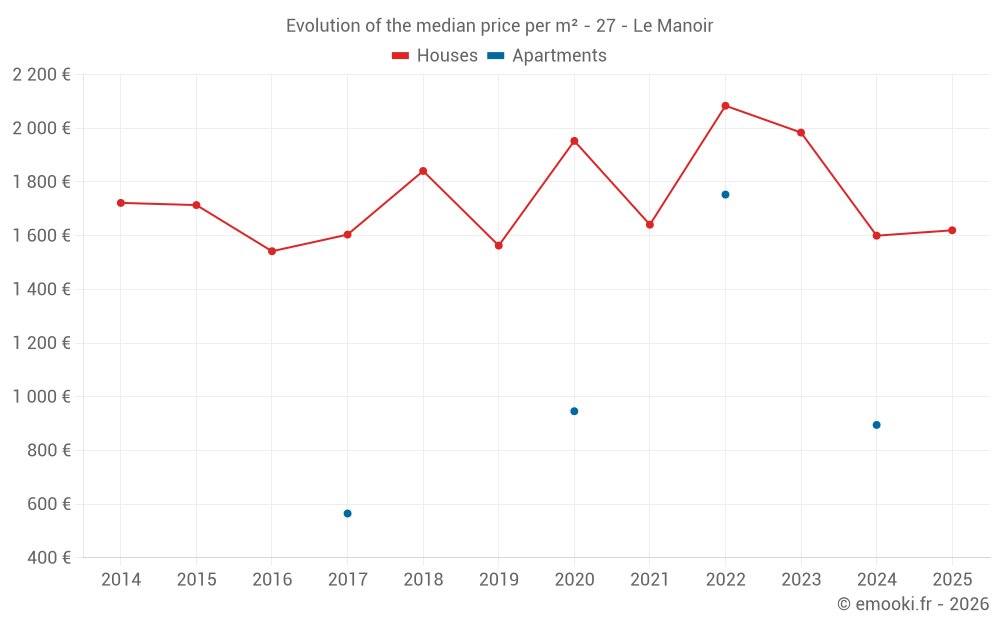
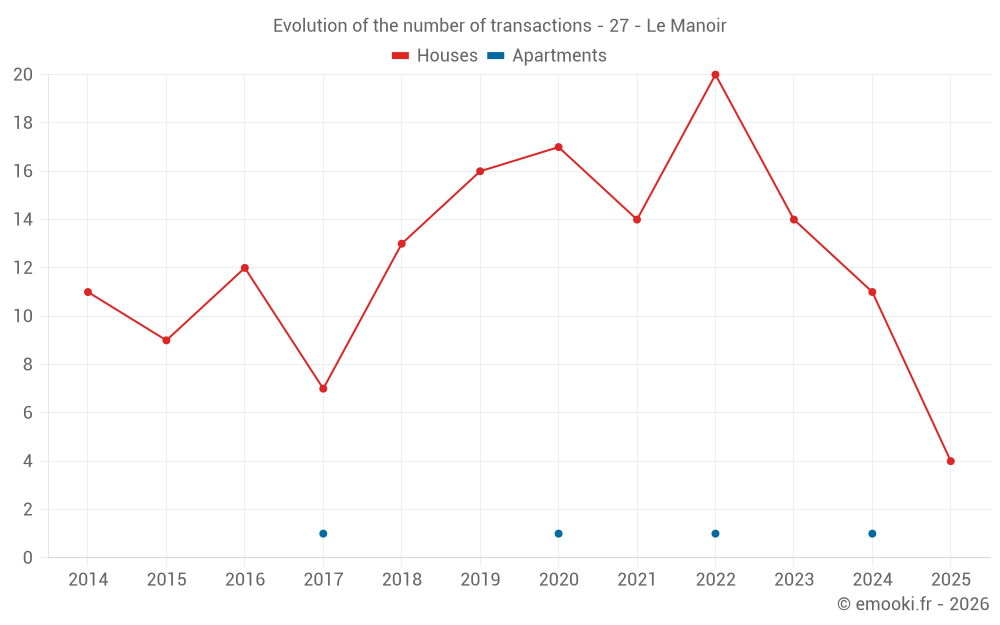
Median price of real estate
in the municipality of Le Manoir

HousesHouses
1 693  /m²
1-23-45-67-89-10
Reliability 7/10
Median price on the 24 transactions of the last 24 months.
from 1 204 to
2 205  /m²
60% of transactions from the 2nd to the 8th deciles.
ApartmentsApartments
920  /m²
1-23-45-67-89-10
Reliability 1/10
Median price on the 4 transactions of the last 120 months.
DwellingsDwellings
1 692  /m²
1-23-45-67-89-10
Reliability 7/10
Median price on the 25 transactions of the last 24 months.
from 1 150 to
2 170  /m²
60% of transactions from the 2nd to the 8th deciles.
HousesEvolution of the price per m² of houses since...
1 year
+1.2%
2 years
-18%
3 years
-22%
4 years
-1.3%
5 years
-17%
6 years
+3.6%
7 years
-12%
8 years
+1%
9 years
+5.1%
10 years
-5.5%
11 years
-5.9%
The price per m² of houses has decreased by 22% since 3 years, but it has increased by 5.1% in 9 years.

Yearly evolution

Evolution of the median price per m²

Evolution of the median price per m² - 27 - Le Manoir

Evolution of the number of transactions

Warning, last year incomplete. Projections made based on the proportions between semesters of the previous year at the departmental/national level and by type of property.

Evolution of the number of transactions - 27 - Le Manoir

Yearly data

Descending order
Year
Houses
house
transactions
Houses
house
Price per m²
Apartments
apt.
transactions
Apartments
apt.
Price per m²
2025
4
1 620 
0
--- 
2024
11
1 600 
1
895 
2023
14
1 984 
0
--- 
2022
20
2 084 
1
1 753 
2021
14
1 641 
0
--- 
2020
17
1 953 
1
946 
2019
16
1 563 
0
--- 
2018
13
1 841 
0
--- 
2017
7
1 604 
1
565 
2016
12
1 542 
0
--- 
2015
9
1 714 
0
--- 
2014
11
1 722 
0
--- 

Analysis

Structure of prices per m²

Values of price percentiles per m² over the periods used for the estimated price of each type of property.

Structure of transaction amounts

Values of transaction amounts percentiles over the periods used for the estimated price of each type of property.

Transaction amounts and prices per m² by percentile

Ascending order
Percentile
Houses
house
Price per m²
Houses
house
Transaction amount
Apartments
apt.
Price per m²
Apartments
apt.
Transaction amount
10th percentile
926 
105 K
664 
88 323 
20th percentile
1 204 
110 K
763 
89 792 
30th percentile
1 473 
118 K
862 
91 260 
40th percentile
1 594 
121 K
905 
107 K
50th percentile
1 693 
128 K
920 
131 K
60th percentile
1 993 
137 K
936 
154 K
70th percentile
2 131 
169 K
1 027 
210 K
80th percentile
2 205 
179 K
1 269 
328 K
90th percentile
2 401 
204 K
1 511 
447 K

National and departmental comparison

Evolution of the median price per m² of houses

Evolution of the median price per m² of apartments

Quarterly evolution

Evolution of the median price per m²

Evolution of the number of transactions

Quarterly data

Descending order
Quarter
Houses
house
transactions
Houses
house
Price per m²
Apartments
apt.
transactions
Apartments
apt.
Price per m²
2025 Q2
3
1 546 
0
--- 
2025 Q1
1
2 134 
0
--- 
2024 Q4
3
1 600 
0
--- 
2024 Q3
4
1 204 
1
895 
2024 Q2
3
2 116 
0
--- 
2024 Q1
1
2 311 
0
--- 
2023 Q4
2
1 990 
0
--- 
2023 Q3
7
1 967 
0
--- 
2023 Q2
3
1 585 
0
--- 
2023 Q1
2
2 268 
0
--- 
2022 Q4
3
924 
0
--- 
2022 Q3
8
2 122 
0
--- 
2022 Q2
5
2 151 
1
1 753 
2022 Q1
4
2 332 
0
--- 
2021 Q4
3
2 100 
0
--- 
2021 Q3
5
1 811 
0
--- 
2021 Q2
3
1 662 
0
--- 
2021 Q1
3
1 333 
0
--- 
2020 Q4
7
1 613 
0
--- 
2020 Q3
4
2 006 
0
--- 
2020 Q2
6
2 174 
1
946 
2019 Q4
2
1 248 
0
--- 
2019 Q3
5
1 431 
0
--- 
2019 Q2
4
1 676 
0
--- 
2019 Q1
5
1 549 
0
--- 
2018 Q4
1
1 460 
0
--- 
2018 Q3
5
2 133 
0
--- 
2018 Q2
7
1 780 
0
--- 
2017 Q3
3
1 388 
0
--- 
2017 Q2
3
2 115 
0
--- 
2017 Q1
1
1 604 
1
565 
2016 Q4
2
1 584 
0
--- 
2016 Q3
6
1 292 
0
--- 
2016 Q2
2
1 567 
0
--- 
2016 Q1
2
1 710 
0
--- 
2015 Q4
4
1 611 
0
--- 
2015 Q3
4
1 614 
0
--- 
2015 Q2
1
2 079 
0
--- 
2014 Q4
4
1 756 
0
--- 
2014 Q3
2
1 802 
0
--- 
2014 Q2
1
2 122 
0
--- 
2014 Q1
4
1 352 
0
--- 

Overview of the latest real estate transactions

The following list is an anonymized overview of the latest transactions. For more details and to find all transactions, please use the map to view transactions by plot or the transaction search page for a search by criteria.

2025-06-23
173 000 
1 210  /m²(143 m²)
Sale
Houses
House
7 rooms
143 m2
Land
518 m2
-Sols
2025-06-20
184 000 
1 546  /m²(119 m²)
Sale
Houses
House
4 rooms
119 m2
1 outbuilding
Land
520 m2
-Sols
Land
142 m2
-Terres
2025-06-10
110 000 
Sale
Land
210 m2
-Sols
2025-05-27
105 000 
1 694  /m²(62 m²)
Sale
Houses
House
4 rooms
62 m2
Land
463 m2
-Sols
2025-01-31
230 450 
2 134  /m²(108 m²)
Sale
Houses
House
5 rooms
108 m2
Land
500 m2
-Sols
Land
251 m2
-Sols
2025-01-16
38 850 
Sale
Land
112 m2
-Terrains à bâtir
Land
11 m2
-Terrains à bâtir
Land
544 m2
-Terrains à bâtir
Land
195 m2
-Terrains à bâtir
Land
5 m2
-Terrains à bâtir
Land
42 m2
-Terrains à bâtir
Land
87 m2
-Terrains à bâtir
Land
299 m2
-Terrains à bâtir
2024-12-19
73 980 
transaction.nature.Vente terrain à bâtir
Land
51 m2
-Sols
Land
92 m2
-Sols
Land
97 m2
-Sols
Land
142 m2
-Terrains d'agrément
Land
357 m2
-Terrains d'agrément
Land
1439 m2
-Terrains d'agrément
2024-12-18
24 930 
Sale
Land
390 m2
-Sols
Land
233 m2
-Sols
2024-12-13
18 000 
Sale
Land
1640 m2
-Jardins
2024-10-16
134 000 
964  /m²(139 m²)
Sale
Houses
House
2 rooms
97 m2
Houses
House
2 rooms
42 m2
1 outbuilding
Land
900 m2
-Sols
2024-10-14
130 000 
2 131  /m²(61 m²)
Sale
Houses
House
4 rooms
61 m2
Land
504 m2
-Sols
2024-10-07
40 000 
1 600  /m²(25 m²)
Sale
Houses
House
2 rooms
25 m2
1 outbuilding
Land
310 m2
-Sols
2024-10-01
113 890 
Sale
Land
2759 m2
-Terres
Land
33 m2
-Prés
2024-09-19
120 000 
909  /m²(132 m²)
Sale
Houses
House
4 rooms
132 m2
1 outbuilding
Land
783 m2
-Sols
2024-08-28
86 854 
895  /m²(97 m²)
Sale
Apartments
Apartment
5 rooms
97 m2
1 outbuilding
Land
216 m2
-Jardins
2024-08-20
158 000 
2 135  /m²(74 m²)
Sale
Houses
House
5 rooms
74 m2
Land
596 m2
-Sols
2024-07-30
125 000 
539  /m²(232 m²)
Sale
Houses
House
3 rooms
68 m2
Houses
House
4 rooms
82 m2
Houses
House
4 rooms
82 m2
Land
184 m2
-Sols
2024-07-30
123 000 
1 500  /m²(82 m²)
Sale
Houses
House
5 rooms
82 m2
Land
535 m2
-Sols
2024-07-08
110 000 
Sale
Land
157 m2
-Sols
2024-06-17
168 000 
2 800  /m²(60 m²)
Sale
Houses
House
4 rooms
60 m2
Land
544 m2
-Sols
216 transactions listed in the municipality

Eure (27)

Most expensive cities

City
name
Descending orderHouses
house
Price per m²
3 113 
2 935 
2 755 
2 737 
2 662 
2 622 
City
name
Descending orderApartments
apt.
Price per m²
2 849 
2 778 
2 658 
2 644 
2 351 
2 308 
2 257 

Least expensive cities

City
name
Ascending orderHouses
house
Price per m²
1 071 
1 178 
1 185 
1 214 
1 224 
1 250 
City
name
Ascending orderApartments
apt.
Price per m²
250 
533 
542