Real estate price map
Real estate price map in the municipality of Vexin-sur-Epte, choose a section to see transactions by parcel.
Eure (27)
Price per m² in Vexin-sur-Epte
Median price of real estate
in the municipality of Vexin-sur-Epte
Houses
2 191 € /m²
Reliability 10/10
Median price on the 21 transactions of the last 3 months.
from 1 889 to
2 697 € /m²
2 697 € /m²
60% of transactions from the 2nd to the 8th deciles.
Apartments
1 260 € /m²
Reliability 2/10
Median price on the 5 transactions of the last 96 months.
Dwellings
2 191 € /m²
Reliability 10/10
Median price on the 21 transactions of the last 3 months.
from 1 889 to
2 697 € /m²
2 697 € /m²
60% of transactions from the 2nd to the 8th deciles.
Evolution of the price per m² of houses since...
1 year
+4.6%
2 years
-0.3%
3 years
-3.4%
4 years
+2.1%
5 years
+16%
6 years
+25%
7 years
+23%
8 years
+23%
9 years
+20%
10 years
+21%
11 years
+19%
The price per m² of houses has decreased by 3.4% since 3 years, but it has increased by 25% in 6 years.
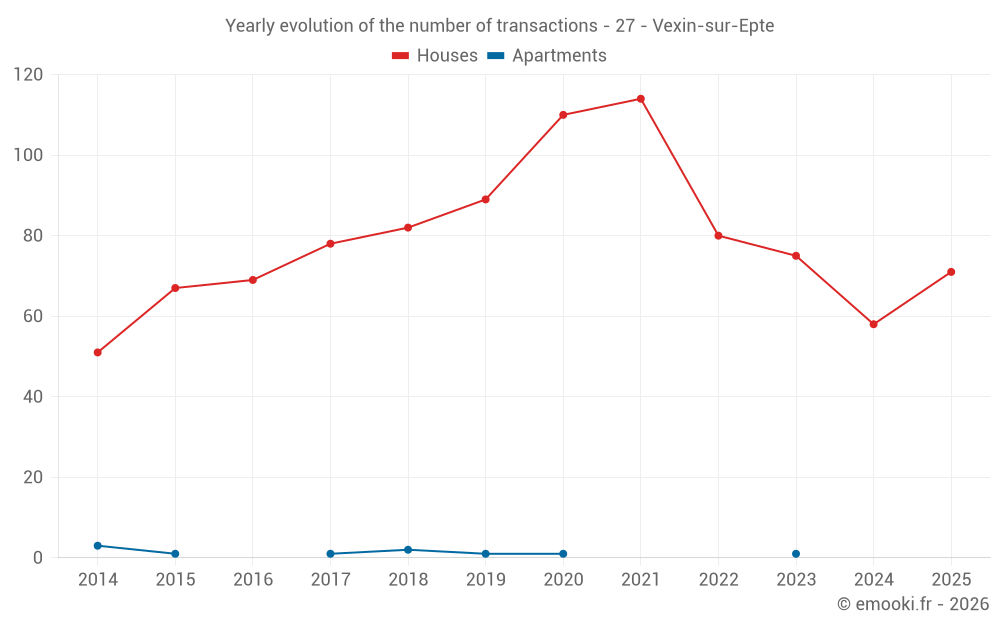
1452 transactions listed in the municipality
Yearly data
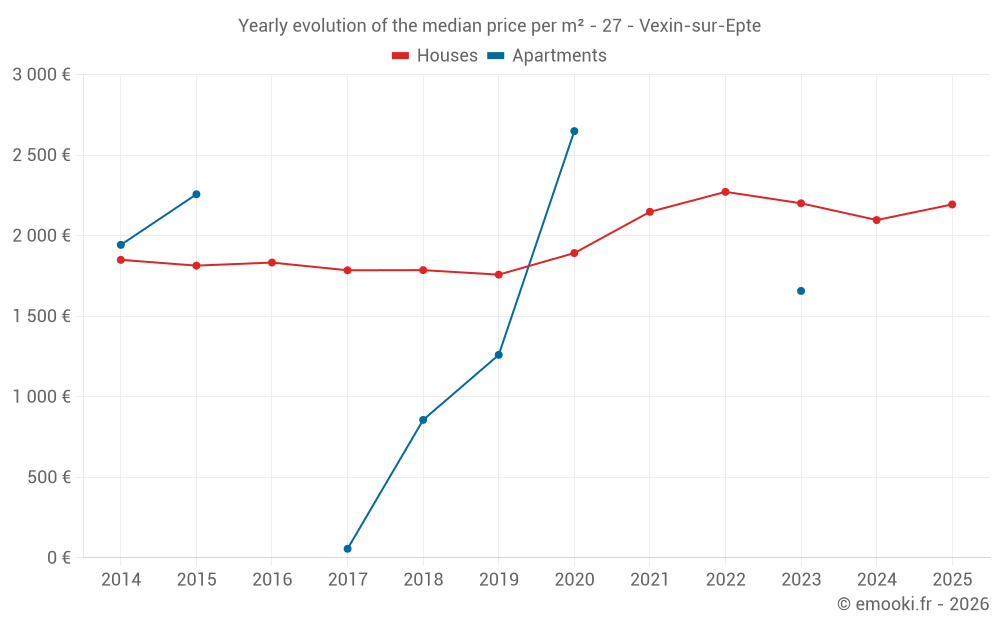
Yearly evolution of the median price per m²
Yearly evolution of the number of transactions
Yearly table
Year
house
transactions
transactions
house
Price per m²
Price per m²
apt.
transactions
transactions
apt.
Price per m²
Price per m²
2025
71
2 194 €
0
--- €
2024
58
2 097 €
0
--- €
2023
75
2 201 €
1
1 657 €
2022
80
2 272 €
0
--- €
2021
114
2 148 €
0
--- €
2020
110
1 892 €
1
2 649 €
2019
89
1 758 €
1
1 260 €
2018
82
1 786 €
2
856 €
2017
78
1 785 €
1
56 €
2016
69
1 833 €
0
--- €
2015
67
1 814 €
1
2 257 €
2014
51
1 850 €
3
1 943 €
Analysis
Structure of prices per m²
Values of price percentiles per m² over the periods used for the estimated price of each type of property.
Structure of transaction amounts
Values of transaction amounts percentiles over the periods used for the estimated price of each type of property.
Transaction amounts and prices per m² by percentile
Percentile
house
Price per m²
Price per m²
house
Transaction amount
Transaction amount
apt.
Price per m²
Price per m²
apt.
Transaction amount
Transaction amount
10th percentile
1 638 €
155 K€
807 €
58 200 €
20th percentile
1 889 €
160 K€
1 002 €
61 400 €
30th percentile
2 068 €
180 K€
1 132 €
65 800 €
40th percentile
2 160 €
180 K€
1 196 €
71 400 €
50th percentile
2 191 €
197 K€
1 260 €
77 000 €
60th percentile
2 299 €
204 K€
1 419 €
92 600 €
70th percentile
2 400 €
205 K€
1 578 €
108 K€
80th percentile
2 697 €
300 K€
1 855 €
130 K€
90th percentile
2 807 €
328 K€
2 252 €
158 K€
National and departmental comparison
Evolution of the median price per m² of houses
Evolution of the median price per m² of apartments
Quarterly data
Quarterly evolution of the median price per m²
Quarterly evolution of the number of transactions
Quarterly table
Quarter
house
transactions
transactions
house
Price per m²
Price per m²
apt.
transactions
transactions
apt.
Price per m²
Price per m²
2025 Q4
21
2 191 €
0
--- €
2025 Q3
21
2 250 €
0
--- €
2025 Q2
16
2 227 €
0
--- €
2025 Q1
13
2 097 €
0
--- €
2024 Q4
15
2 357 €
0
--- €
2024 Q3
21
2 000 €
0
--- €
2024 Q2
11
1 955 €
0
--- €
2024 Q1
11
2 102 €
0
--- €
2023 Q4
15
1 766 €
0
--- €
2023 Q3
24
2 350 €
0
--- €
2023 Q2
20
2 530 €
1
1 657 €
2023 Q1
16
2 170 €
0
--- €
2022 Q4
12
2 334 €
0
--- €
2022 Q3
30
2 491 €
0
--- €
2022 Q2
17
2 189 €
0
--- €
2022 Q1
21
2 036 €
0
--- €
2021 Q4
25
2 002 €
0
--- €
2021 Q3
33
2 147 €
0
--- €
2021 Q2
32
2 131 €
0
--- €
2021 Q1
24
2 163 €
0
--- €
2020 Q4
39
1 893 €
1
2 649 €
2020 Q3
30
2 024 €
0
--- €
2020 Q2
22
1 880 €
0
--- €
2020 Q1
19
1 855 €
0
--- €
2019 Q4
18
1 984 €
0
--- €
2019 Q3
30
1 984 €
0
--- €
2019 Q2
20
1 548 €
1
1 260 €
2019 Q1
21
1 509 €
0
--- €
2018 Q4
22
1 801 €
0
--- €
2018 Q3
22
1 626 €
1
611 €
2018 Q2
17
1 956 €
0
--- €
2018 Q1
21
1 723 €
1
1 100 €
2017 Q4
23
1 702 €
0
--- €
2017 Q3
22
2 015 €
1
56 €
2017 Q2
19
1 790 €
0
--- €
2017 Q1
14
1 662 €
0
--- €
2016 Q4
19
1 833 €
0
--- €
2016 Q3
13
1 779 €
0
--- €
2016 Q2
15
1 888 €
0
--- €
2016 Q1
22
1 860 €
0
--- €
2015 Q4
24
1 713 €
0
--- €
2015 Q3
21
1 726 €
0
--- €
2015 Q2
9
1 226 €
1
2 257 €
2015 Q1
13
2 111 €
0
--- €
2014 Q4
16
1 929 €
0
--- €
2014 Q3
16
1 876 €
0
--- €
2014 Q2
8
1 726 €
2
1 910 €
2014 Q1
11
1 611 €
1
1 943 €
Key takeaways
What is the price per m2 of houses in Vexin-sur-Epte?
The median price on the 21 house transactions of the last 3 months in the municipality of Vexin-sur-Epte was 2 191 € per square meter for a median property value of 197 200 €. Over this period, 60% of transactions were between 1 889 and 2 697 € per square meter (from the 2nd to the 8th deciles).
Compare with neighboring municipalities
City
name
name
house
Price per m²
Price per m²
apt.
Price per m²
Price per m²
City information
Zip codes
- CAHAIGNES 27420 VEXIN SUR EPTE
- CANTIERS 27420 VEXIN SUR EPTE
- FONTENAY EN VEXIN 27510 VEXIN SUR EPTE
- FORET LA FOLIE 27510 VEXIN SUR EPTE
- GUITRY 27510 VEXIN SUR EPTE
- PANILLEUSE 27510 VEXIN SUR EPTE
- TOURNY 27510 VEXIN SUR EPTE
- BERTHENONVILLE 27630 VEXIN SUR EPTE
- BUS ST REMY 27630 VEXIN SUR EPTE
- CIVIERES 27630 VEXIN SUR EPTE
- DAMPSMESNIL 27630 VEXIN SUR EPTE
- ECOS 27630 VEXIN SUR EPTE
- FOURGES 27630 VEXIN SUR EPTE
- FOURS EN VEXIN 27630 VEXIN SUR EPTE