emooki
HomePrice mapTransactions
🇬🇧 English🇫🇷 Français🇩🇪 Deutsch🇪🇸 Español🇮🇹 Italiano

Real estate price map


Real estate price map in the municipality of Bernay.

Eure (27)
Bernay

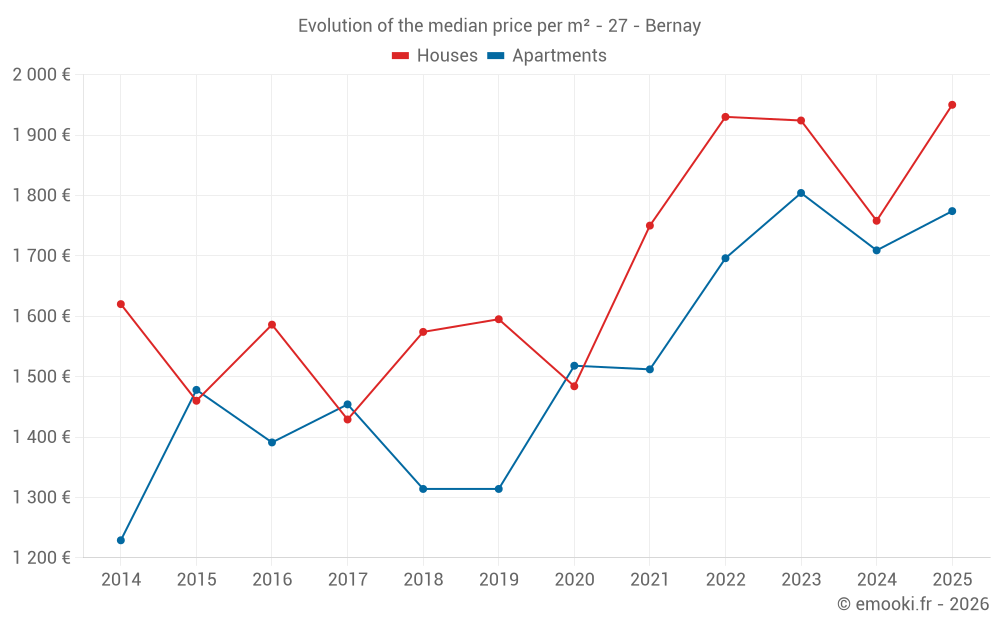
Median price of real estate
in the municipality of Bernay

HousesHouses
1 950 € /m²
1-23-45-67-89-10
Reliability 9/10
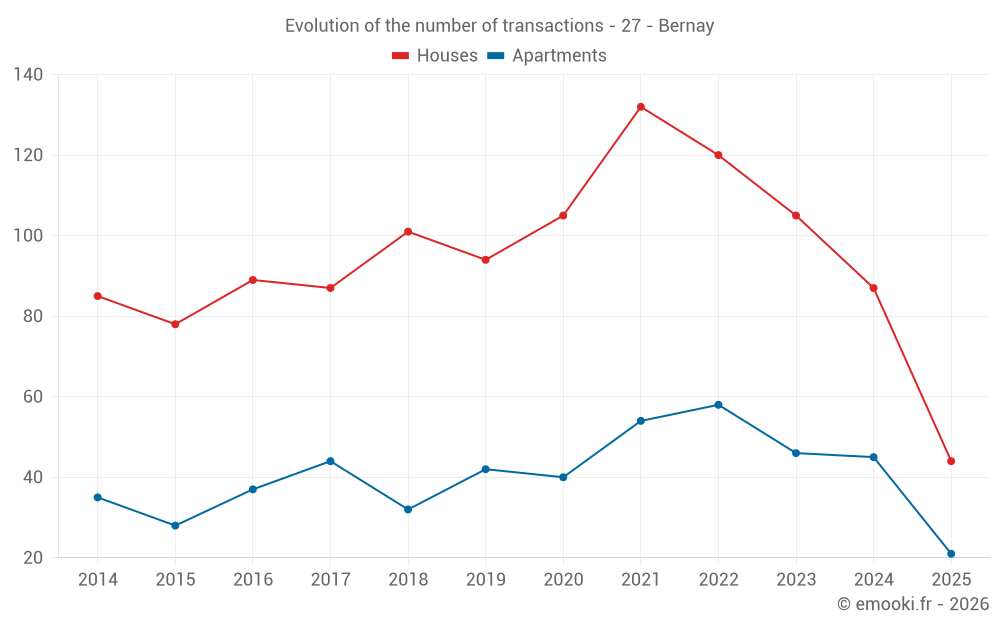
Median price on the 44 transactions of the last 6 months.
from 1 233 to
2 377 € /m²
60% of transactions from the 2nd to the 8th deciles.
ApartmentsApartments
1 774 € /m²
1-23-45-67-89-10
Reliability 9/10
Median price on the 21 transactions of the last 6 months.
from 1 184 to
1 985 € /m²
60% of transactions from the 2nd to the 8th deciles.
DwellingsDwellings
1 846 € /m²
1-23-45-67-89-10
Reliability 10/10
Median price on the 28 transactions of the last 3 months.
from 1 219 to
2 492 € /m²
60% of transactions from the 2nd to the 8th deciles.
HousesEvolution of the price per m² of houses since...
1 year
+11%
2 years
+1.4%
3 years
+1%
4 years
+11%
5 years
+31%
6 years
+22%
7 years
+24%
8 years
+36%
9 years
+23%
10 years
+34%
11 years
+20%
ApartmentsEvolution of the price per m² of apartments since...
1 year
+3.8%
2 years
-1.7%
3 years
+4.6%
4 years
+17%
5 years
+17%
6 years
+35%
7 years
+35%
8 years
+22%
9 years
+28%
10 years
+20%
11 years
+44%

Yearly evolution

Evolution of the median price per m²

Evolution of the number of transactions

Warning, last year incomplete. Projections made based on the proportions between semesters of the previous year at the departmental/national level and by type of property.

Yearly data

Descending order
Year
Houses
house
transactions
Houses
house
Price per m²
Apartments
apt.
transactions
Apartments
apt.
Price per m²
2025
44
1 950 €
21
1 774 €
2024
87
1 758 €
45
1 709 €
2023
105
1 924 €
46
1 804 €
2022
120
1 930 €
58
1 696 €
2021
132
1 750 €
54
1 512 €
2020
105
1 484 €
40
1 518 €
2019
94
1 595 €
42
1 314 €
2018
101
1 574 €
32
1 314 €
2017
87
1 429 €
44
1 454 €
2016
89
1 586 €
37
1 391 €
2015
78
1 460 €
28
1 478 €
2014
85
1 620 €
35
1 229 €

Analysis

Structure of prices per m²

Values of price percentiles per m² over the periods used for the estimated price of each type of property.

Structure of transaction amounts

Values of transaction amounts percentiles over the periods used for the estimated price of each type of property.

Transaction amounts and prices per m² by percentile

Ascending order
Percentile
Houses
house
Price per m²
Houses
house
Transaction amount
Apartments
apt.
Price per m²
Apartments
apt.
Transaction amount
10th percentile
1 093 €
61 800 €
730 €
66 300 €
20th percentile
1 233 €
92 600 €
1 184 €
77 000 €
30th percentile
1 468 €
129 K€
1 304 €
89 000 €
40th percentile
1 750 €
151 K€
1 750 €
95 000 €
50th percentile
1 950 €
176 K€
1 774 €
114 K€
60th percentile
2 065 €
199 K€
1 841 €
140 K€
70th percentile
2 210 €
238 K€
1 852 €
174 K€
80th percentile
2 377 €
270 K€
1 985 €
200 K€
90th percentile
2 719 €
333 K€
2 375 €
284 K€

National and departmental comparison

Evolution of the median price per m² of houses

Evolution of the median price per m² of apartments

Quarterly evolution

Evolution of the median price per m²

Evolution of the number of transactions

Quarterly data

Descending order
Quarter
Houses
house
transactions
Houses
house
Price per m²
Apartments
apt.
transactions
Apartments
apt.
Price per m²
2025 Q2
18
1 933 €
10
1 808 €
2025 Q1
26
1 968 €
11
1 750 €
2024 Q4
22
1 760 €
16
1 632 €
2024 Q3
22
1 715 €
12
1 580 €
2024 Q2
19
1 765 €
10
1 663 €
2024 Q1
24
1 894 €
7
2 183 €
2023 Q4
26
1 970 €
12
1 689 €
2023 Q3
26
2 011 €
12
1 562 €
2023 Q2
30
1 858 €
11
1 778 €
2023 Q1
23
1 982 €
11
1 941 €
2022 Q4
31
2 080 €
19
1 500 €
2022 Q3
24
1 905 €
17
1 725 €
2022 Q2
27
1 844 €
12
1 830 €
2022 Q1
38
1 915 €
10
1 542 €
2021 Q4
34
1 869 €
14
1 518 €
2021 Q3
31
1 879 €
11
1 585 €
2021 Q2
38
1 651 €
17
1 569 €
2021 Q1
29
1 613 €
12
1 440 €
2020 Q4
44
1 746 €
12
1 644 €
2020 Q3
18
1 320 €
9
1 469 €
2020 Q2
22
1 406 €
10
1 442 €
2020 Q1
21
1 389 €
9
1 491 €
2019 Q4
20
1 538 €
8
1 413 €
2019 Q3
23
1 757 €
9
1 343 €
2019 Q2
26
1 621 €
16
1 200 €
2019 Q1
25
1 400 €
9
1 663 €
2018 Q4
26
1 616 €
5
1 600 €
2018 Q3
33
1 517 €
9
1 185 €
2018 Q2
19
1 547 €
9
1 316 €
2018 Q1
23
1 667 €
9
1 313 €
2017 Q4
22
1 114 €
14
1 519 €
2017 Q3
22
1 490 €
5
1 663 €
2017 Q2
23
1 517 €
11
1 389 €
2017 Q1
20
1 602 €
14
1 280 €
2016 Q4
18
1 398 €
10
1 278 €
2016 Q3
30
1 650 €
5
1 406 €
2016 Q2
21
1 548 €
14
1 300 €
2016 Q1
20
1 608 €
8
1 494 €
2015 Q4
22
1 537 €
8
1 138 €
2015 Q3
20
1 448 €
6
1 635 €
2015 Q2
17
1 653 €
6
1 460 €
2015 Q1
19
1 361 €
8
1 768 €
2014 Q4
23
1 587 €
6
1 710 €
2014 Q3
24
1 630 €
4
1 159 €
2014 Q2
15
1 632 €
9
1 225 €
2014 Q1
23
1 620 €
16
1 196 €

Eure (27)

Most expensive cities

City
name
Descending orderHouses
house
Price per m²
3 113 €
2 935 €
2 755 €
2 737 €
2 732 €
2 728 €
2 677 €
2 667 €
2 662 €
2 622 €
City
name
Descending orderApartments
apt.
Price per m²
2 849 €
2 778 €
2 658 €
2 644 €
2 351 €
2 346 €
2 323 €
2 308 €
2 262 €
2 257 €

Least expensive cities

City
name
Ascending orderHouses
house
Price per m²
1 071 €
1 170 €
1 170 €
1 178 €
1 185 €
1 214 €
1 223 €
1 224 €
1 250 €
1 270 €
City
name
Ascending orderApartments
apt.
Price per m²
122 €
250 €
503 €
533 €
542 €
582 €
592 €
636 €