Real estate price map
Real estate price map in the municipality of Mesnil-en-Ouche, choose a section to see transactions by parcel.
Price per m² in Mesnil-en-Ouche
Median price of real estate
in the municipality of Mesnil-en-Ouche
2 195 € /m²
2 181 € /m²
1593 transactions listed in the municipality
Yearly data
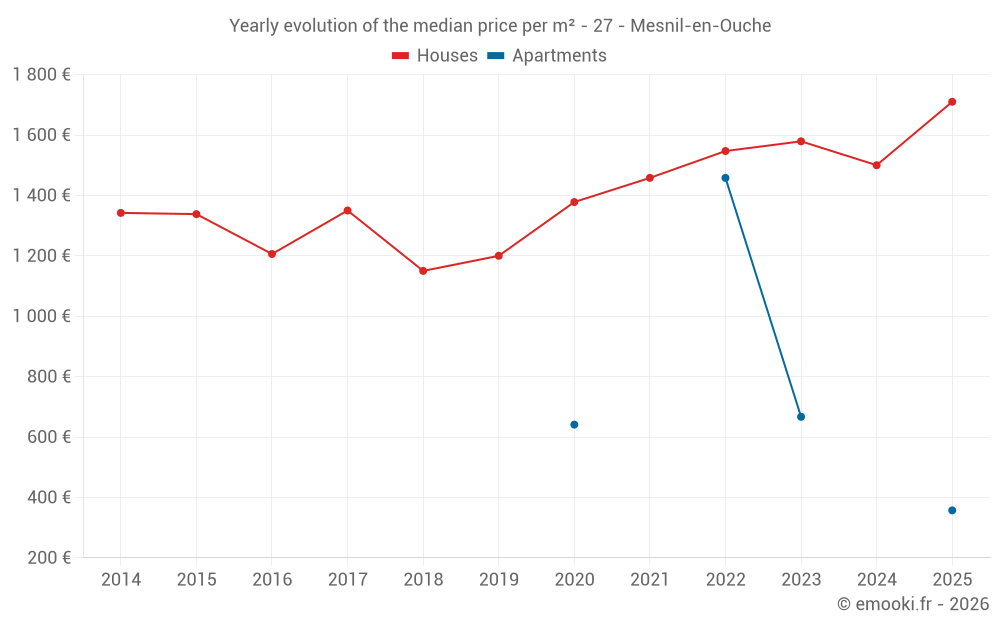
Yearly evolution of the median price per m²
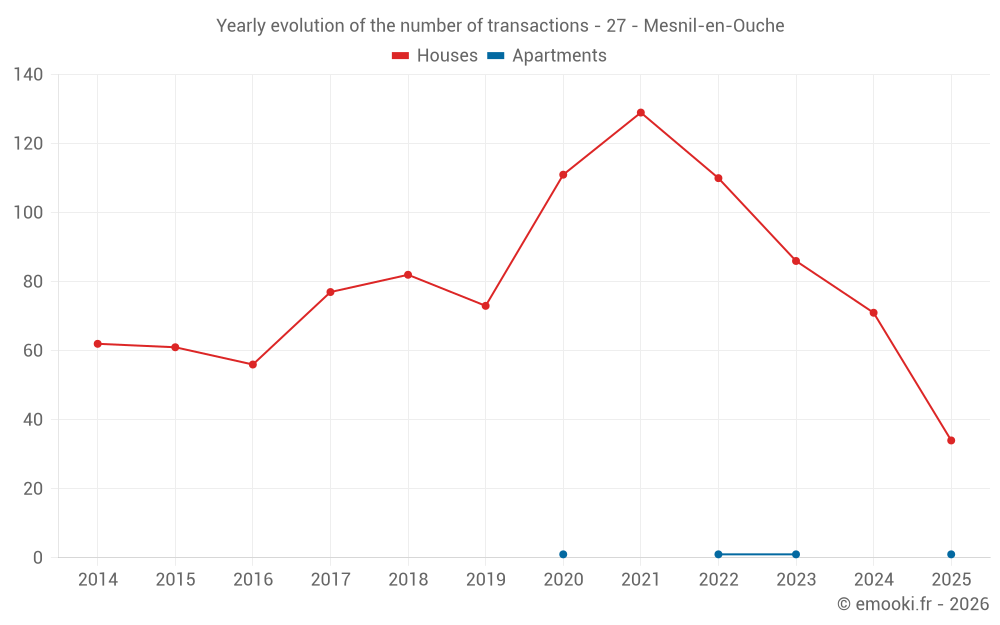
Yearly evolution of the number of transactions
Warning, last year incomplete. Projections made based on the proportions between semesters of the previous year at the departmental/national level and by type of property.
Yearly table
transactions
Price per m²
transactions
Price per m²
Analysis
Structure of prices per m²
Values of price percentiles per m² over the periods used for the estimated price of each type of property.
Structure of transaction amounts
Values of transaction amounts percentiles over the periods used for the estimated price of each type of property.
Transaction amounts and prices per m² by percentile
Price per m²
Transaction amount
Price per m²
Transaction amount
National and departmental comparison
Evolution of the median price per m² of houses
Evolution of the median price per m² of apartments
Quarterly data
Quarterly evolution of the median price per m²
Quarterly evolution of the number of transactions
Quarterly table
transactions
Price per m²
transactions
Price per m²
Key takeaways
What is the price per m2 of houses in Mesnil-en-Ouche?
The median price on the 34 house transactions of the last 6 months in the municipality of Mesnil-en-Ouche was 1 710 € per square meter for a median property value of 149 500 €. Over this period, 60% of transactions were between 1 314 and 2 195 € per square meter (from the 2nd to the 8th deciles).
Compare with neighboring municipalities
name
Price per m²
Price per m²
City information
Zip codes
- LA ROUSSIERE 27270 MESNIL EN OUCHE
- BOSC RENOULT EN OUCHE 27330 MESNIL EN OUCHE
- EPINAY 27330 MESNIL EN OUCHE
- GISAY LA COUDRE 27330 MESNIL EN OUCHE
- LA BARRE EN OUCHE 27330 MESNIL EN OUCHE
- ST PIERRE DU MESNIL 27330 MESNIL EN OUCHE
- THEVRAY 27330 MESNIL EN OUCHE
- AJOU 27410 MESNIL EN OUCHE
- BEAUMESNIL 27410 MESNIL EN OUCHE
- GOUTTIERES 27410 MESNIL EN OUCHE
- GRANCHAIN 27410 MESNIL EN OUCHE
- JONQUERETS DE LIVET 27410 MESNIL EN OUCHE
- LANDEPEREUSE 27410 MESNIL EN OUCHE
- ST AUBIN DES HAYES 27410 MESNIL EN OUCHE
- ST AUBIN LE GUICHARD 27410 MESNIL EN OUCHE
- STE MARGUERITE EN OUCHE 27410 MESNIL EN OUCHE
- THEVRAY 27410 MESNIL EN OUCHE