emooki
HomePrice mapTransactions
🇬🇧 English🇫🇷 Français🇩🇪 Deutsch🇪🇸 Español🇮🇹 Italiano

Real estate price map


Real estate price map in the municipality of Saint-Barthélemy-de-Vals.

Drôme (26)
Saint-Barthélemy-de-Vals

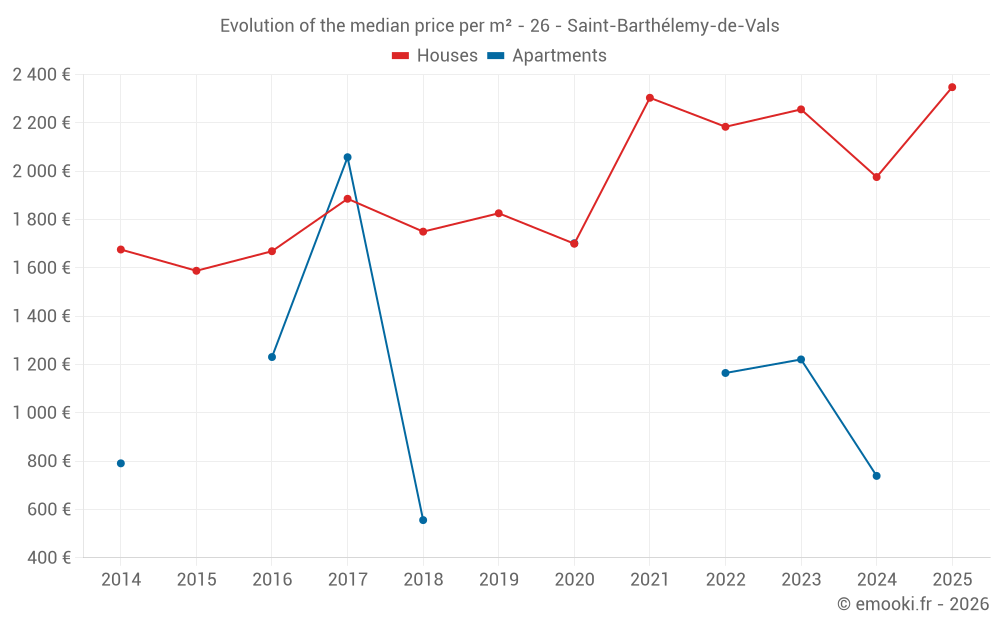
Median price of real estate
in the municipality of Saint-Barthélemy-de-Vals

HousesHouses
2 216  /m²
1-23-45-67-89-10
Reliability 7/10
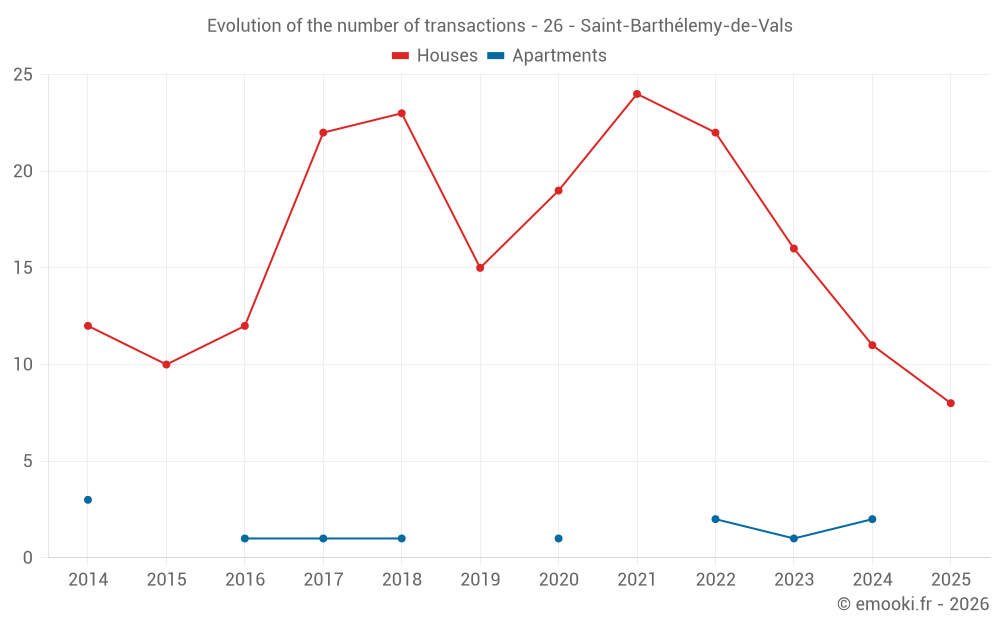
Median price on the 26 transactions of the last 24 months.
from 1 568 to
2 684  /m²
60% of transactions from the 2nd to the 8th deciles.
ApartmentsApartments
1 106  /m²
1-23-45-67-89-10
Reliability 3/10
Median price on the 6 transactions of the last 72 months.
DwellingsDwellings
2 172  /m²
1-23-45-67-89-10
Reliability 7/10
Median price on the 29 transactions of the last 24 months.
from 1 421 to
2 622  /m²
60% of transactions from the 2nd to the 8th deciles.
HousesEvolution of the price per m² of houses since...
1 year
+19%
2 years
+4.1%
3 years
+7.5%
4 years
+1.9%
5 years
+38%
6 years
+29%
7 years
+34%
8 years
+24%
9 years
+41%
10 years
+48%
11 years
+40%
ApartmentsEvolution of the price per m² of apartments since...
1 year
--
2 years
--
3 years
--
4 years
--
5 years
--
6 years
--
7 years
--
8 years
--
9 years
--
10 years
--
11 years
--

Yearly evolution

Evolution of the median price per m²

Evolution of the number of transactions

Warning, last year incomplete. Projections made based on the proportions between semesters of the previous year at the departmental/national level and by type of property.

Yearly data

Descending order
Year
Houses
house
transactions
Houses
house
Price per m²
Apartments
apt.
transactions
Apartments
apt.
Price per m²
2025
8
2 348 
0
--- 
2024
11
1 976 
2
739 
2023
16
2 256 
1
1 221 
2022
22
2 184 
2
1 165 
2021
24
2 304 
0
--- 
2020
19
1 700 
1
1 702 
2019
15
1 826 
0
--- 
2018
23
1 750 
1
556 
2017
22
1 886 
1
2 058 
2016
12
1 669 
1
1 231 
2015
10
1 588 
0
--- 
2014
12
1 676 
3
791 

Analysis

Structure of prices per m²

Values of price percentiles per m² over the periods used for the estimated price of each type of property.

Structure of transaction amounts

Values of transaction amounts percentiles over the periods used for the estimated price of each type of property.

Transaction amounts and prices per m² by percentile

Ascending order
Percentile
Houses
house
Price per m²
Houses
house
Transaction amount
Apartments
apt.
Price per m²
Apartments
apt.
Transaction amount
10th percentile
1 420 
127 K
739 
68 750 
20th percentile
1 568 
162 K
822 
74 000 
30th percentile
1 868 
181 K
906 
77 000 
40th percentile
2 100 
195 K
990 
80 000 
50th percentile
2 216 
206 K
1 106 
97 900 
60th percentile
2 317 
225 K
1 221 
116 K
70th percentile
2 412 
247 K
1 280 
123 K
80th percentile
2 684 
295 K
1 340 
130 K
90th percentile
2 723 
324 K
1 521 
184 K

National and departmental comparison

Evolution of the median price per m² of houses

Evolution of the median price per m² of apartments

Quarterly evolution

Evolution of the median price per m²

Evolution of the number of transactions

Quarterly data

Descending order
Quarter
Houses
house
transactions
Houses
house
Price per m²
Apartments
apt.
transactions
Apartments
apt.
Price per m²
2025 Q2
5
2 270 
0
--- 
2025 Q1
3
2 684 
0
--- 
2024 Q4
2
1 895 
0
--- 
2024 Q3
2
1 894 
1
822 
2024 Q2
4
1 673 
1
656 
2024 Q1
3
2 172 
0
--- 
2023 Q4
5
1 958 
0
--- 
2023 Q3
2
2 517 
1
1 221 
2023 Q2
6
2 566 
0
--- 
2023 Q1
3
1 957 
0
--- 
2022 Q4
2
2 147 
1
1 340 
2022 Q3
8
2 492 
0
--- 
2022 Q2
5
2 154 
0
--- 
2022 Q1
7
2 099 
1
990 
2021 Q4
4
2 280 
0
--- 
2021 Q3
9
2 337 
0
--- 
2021 Q2
9
2 245 
0
--- 
2021 Q1
2
1 886 
0
--- 
2020 Q4
4
1 140 
1
1 702 
2020 Q3
5
1 642 
0
--- 
2020 Q2
6
2 204 
0
--- 
2020 Q1
4
1 838 
0
--- 
2019 Q4
5
1 688 
0
--- 
2019 Q3
5
2 041 
0
--- 
2019 Q2
2
1 332 
0
--- 
2019 Q1
3
1 327 
0
--- 
2018 Q4
10
1 437 
0
--- 
2018 Q3
6
2 006 
1
556 
2018 Q2
7
2 028 
0
--- 
2017 Q4
4
1 840 
1
2 058 
2017 Q3
5
1 623 
0
--- 
2017 Q2
5
2 081 
0
--- 
2017 Q1
8
1 889 
0
--- 
2016 Q4
1
992 
0
--- 
2016 Q3
3
1 990 
0
--- 
2016 Q2
3
1 628 
1
1 231 
2016 Q1
5
1 633 
0
--- 
2015 Q4
2
1 347 
0
--- 
2015 Q3
6
1 701 
0
--- 
2015 Q2
2
1 588 
0
--- 
2014 Q4
3
1 250 
1
1 103 
2014 Q3
3
2 173 
0
--- 
2014 Q2
2
1 004 
2
744 
2014 Q1
4
1 747 
0
--- 

Drôme (26)

Most expensive cities

City
name
Descending orderHouses
house
Price per m²
3 880 
3 722 
3 404 
3 368 
3 361 
3 333 
3 314 
City
name
Descending orderApartments
apt.
Price per m²
9 900 
4 407 
3 265 
3 044 
2 987 
2 905 
2 872 

Least expensive cities

City
name
Ascending orderHouses
house
Price per m²
604 
769 
918 
1 000 
1 042 
1 058 
1 102 
1 120 
City
name
Ascending orderApartments
apt.
Price per m²
189 
303 
500 
583 
710 
718