emooki
HomePrice mapTransactions
🇬🇧 English🇫🇷 Français🇩🇪 Deutsch🇪🇸 Español🇮🇹 Italiano

Real estate price map


Real estate price map in the municipality of Hostun, choose a section to see transactions by parcel.

Drôme (26)

Hostun - Real estate price m²

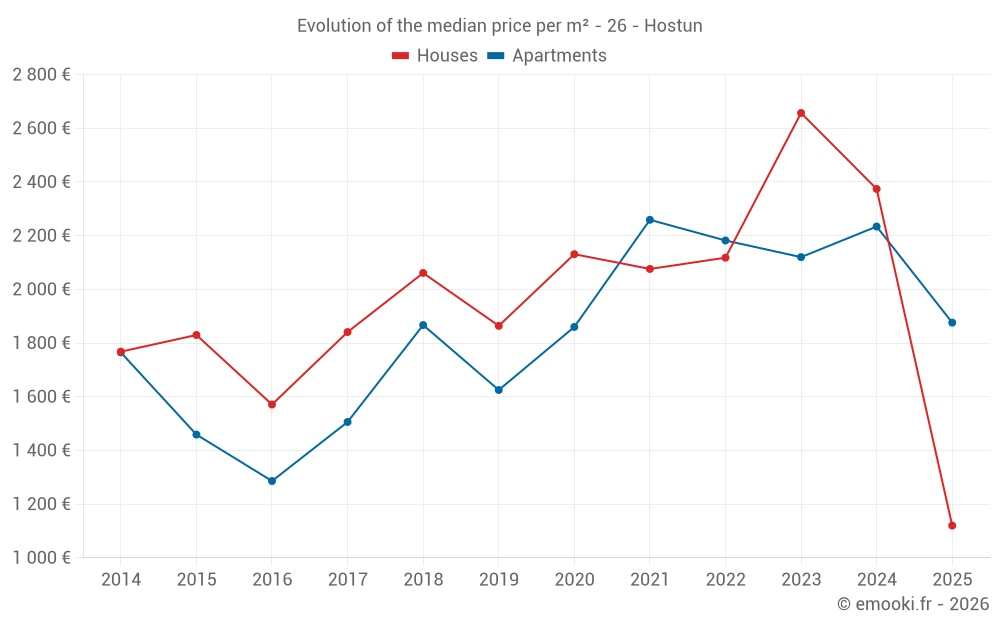
Median price of real estate
in the municipality of Hostun

HousesHouses
2 516  /m²
1-23-45-67-89-10
Reliability 7/10
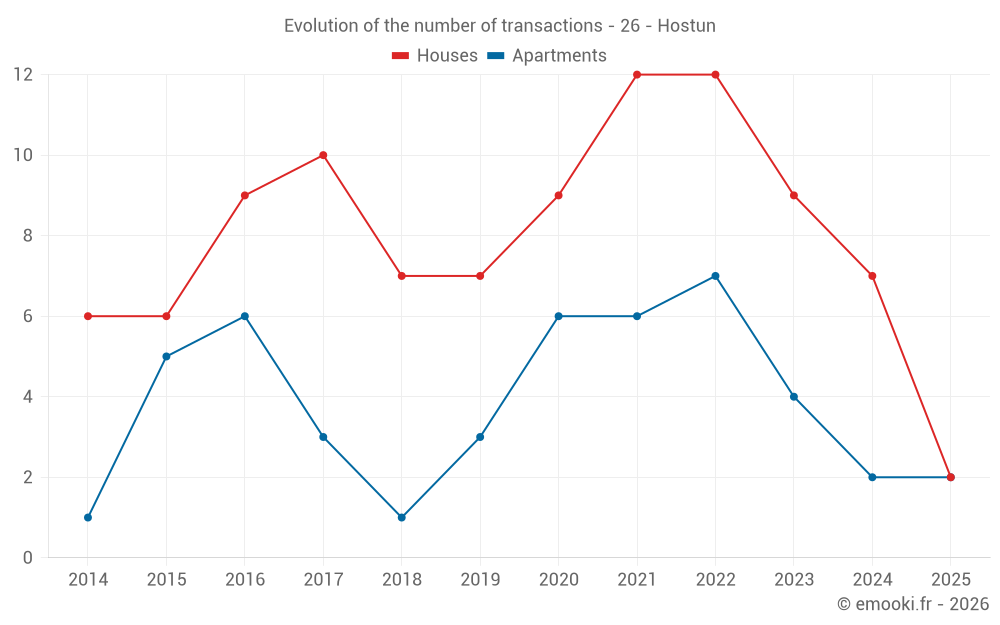
Median price on the 14 transactions of the last 24 months.
from 1 440 to
2 958  /m²
60% of transactions from the 2nd to the 8th deciles.
ApartmentsApartments
2 123  /m²
1-23-45-67-89-10
Reliability 6/10
Median price on the 13 transactions of the last 36 months.
from 1 998 to
2 219  /m²
60% of transactions from the 2nd to the 8th deciles.
DwellingsDwellings
2 186  /m²
1-23-45-67-89-10
Reliability 7/10
Median price on the 20 transactions of the last 24 months.
from 1 601 to
2 713  /m²
60% of transactions from the 2nd to the 8th deciles.

Yearly evolution

Evolution of the median price per m²

Evolution of the median price per m² - 26 - Hostun

Evolution of the number of transactions

Warning, last year incomplete. Projections made based on the proportions between semesters of the previous year at the departmental/national level and by type of property.

Evolution of the number of transactions - 26 - Hostun

Yearly data

Descending order
Year
Houses
house
transactions
Houses
house
Price per m²
Apartments
apt.
transactions
Apartments
apt.
Price per m²
2025
2
1 120 
2
1 876 
2024
7
2 374 
2
2 234 
2023
9
2 657 
4
2 120 
2022
12
2 118 
7
2 182 
2021
12
2 076 
6
2 259 
2020
9
2 131 
6
1 860 
2019
7
1 864 
3
1 625 
2018
7
2 061 
1
1 867 
2017
10
1 841 
3
1 506 
2016
9
1 571 
6
1 286 
2015
6
1 830 
5
1 459 
2014
6
1 768 
1
1 765 

Analysis

Structure of prices per m²

Values of price percentiles per m² over the periods used for the estimated price of each type of property.

Structure of transaction amounts

Values of transaction amounts percentiles over the periods used for the estimated price of each type of property.

Transaction amounts and prices per m² by percentile

Ascending order
Percentile
Houses
house
Price per m²
Houses
house
Transaction amount
Apartments
apt.
Price per m²
Apartments
apt.
Transaction amount
10th percentile
770 
96 500 
1 810 
119 K
20th percentile
1 440 
141 K
1 998 
132 K
30th percentile
1 681 
159 K
2 024 
141 K
40th percentile
2 275 
203 K
2 099 
146 K
50th percentile
2 516 
225 K
2 123 
151 K
60th percentile
2 665 
256 K
2 124 
155 K
70th percentile
2 694 
289 K
2 148 
164 K
80th percentile
2 958 
321 K
2 219 
168 K
90th percentile
3 686 
377 K
2 388 
192 K

National and departmental comparison

Evolution of the median price per m² of houses

Evolution of the median price per m² of apartments

Quarterly evolution

Evolution of the median price per m²

Evolution of the number of transactions

Quarterly data

Descending order
Quarter
Houses
house
transactions
Houses
house
Price per m²
Apartments
apt.
transactions
Apartments
apt.
Price per m²
2025 Q2
1
606 
1
1 986 
2025 Q1
1
1 633 
1
1 766 
2024 Q4
1
2 374 
1
2 440 
2024 Q3
0
--- 
1
2 029 
2024 Q2
4
1 909 
0
--- 
2024 Q1
2
3 094 
0
--- 
2023 Q4
1
2 657 
1
2 123 
2023 Q3
4
2 982 
1
1 471 
2023 Q2
0
--- 
1
2 124 
2023 Q1
4
2 134 
1
2 117 
2022 Q4
2
2 400 
2
2 130 
2022 Q3
4
1 870 
3
2 182 
2022 Q2
4
2 116 
0
--- 
2022 Q1
2
1 954 
2
2 320 
2021 Q4
1
1 477 
5
2 290 
2021 Q3
6
2 120 
0
--- 
2021 Q2
0
--- 
1
1 789 
2021 Q1
5
2 066 
0
--- 
2020 Q4
1
1 944 
1
1 495 
2020 Q3
4
2 174 
1
2 200 
2020 Q2
1
1 176 
2
1 766 
2020 Q1
3
2 548 
2
2 189 
2019 Q4
2
2 346 
1
1 625 
2019 Q3
3
1 706 
1
1 824 
2019 Q2
1
1 971 
1
1 494 
2019 Q1
1
1 667 
0
--- 
2018 Q4
1
2 625 
0
--- 
2018 Q3
1
2 022 
0
--- 
2018 Q2
2
2 105 
1
1 867 
2018 Q1
3
2 061 
0
--- 
2017 Q4
0
--- 
2
835 
2017 Q3
8
1 890 
1
1 814 
2017 Q2
2
1 394 
0
--- 
2016 Q4
1
1 510 
1
1 738 
2016 Q3
2
2 036 
0
--- 
2016 Q2
1
2 090 
3
1 183 
2016 Q1
5
1 287 
2
940 
2015 Q4
1
1 866 
2
1 174 
2015 Q3
2
2 038 
0
--- 
2015 Q2
2
1 790 
1
922 
2015 Q1
1
1 544 
2
1 536 
2014 Q3
2
1 991 
0
--- 
2014 Q2
4
1 706 
1
1 765 

Overview of the latest real estate transactions

The following list is an anonymized overview of the latest transactions. For more details and to find all transactions, please use the map to view transactions by plot or the transaction search page for a search by criteria.

2025-05-09
168 800 
1 986  /m²(85 m²)
Sale
Apartments
Apartment
4 rooms
85 m2
1 outbuilding
2025-04-24
1 000 
Sale
Land
1088 m2
-Sols
2025-04-09
80 000 
606  /m²(132 m²)
Sale
Houses
House
6 rooms
132 m2
Land
146 m2
-Sols
2025-03-04
261 200 
1 633  /m²(160 m²)
Sale
Houses
House
6 rooms
160 m2
2 outbuildings
Land
331 m2
-Sols
2025-01-23
153 650 
1 766  /m²(87 m²)
Sale
Apartments
Apartment
4 rooms
87 m2
3 outbuildings
2024-12-04
235 000 
2 374  /m²(99 m²)
Sale
Houses
House
5 rooms
99 m2
Land
500 m2
-Sols
Land
605 m2
-Terrains d'agrément
2024-11-21
197 600 
2 440  /m²(81 m²)
Sale
Apartments
Apartment
4 rooms
81 m2
2 outbuildings
2024-09-26
91 000 
Sale
Land
73 m2
-Sols
Land
305 m2
-Terrains à bâtir
Land
664 m2
-Terrains à bâtir
Land
293 m2
-Terrains à bâtir
2024-09-06
140 000 
2 029  /m²(69 m²)
Sale
Apartments
Apartment
3 rooms
69 m2
1 outbuilding
2024-08-01
68 000 
Sale
Land
170 m2
-Terres
Land
341 m2
-Terres
2024-06-18
200 000 
2 667  /m²(75 m²)
Sale
Houses
House
3 rooms
75 m2
Land
879 m2
-Sols
Land
786 m2
-Sols
Land
1460 m2
-Sols
2024-06-18
214 000 
2 675  /m²(80 m²)
Sale
Houses
House
4 rooms
80 m2
2 outbuildings
Land
1030 m2
-Sols
2024-06-12
5 100 
Sale
Land
1330 m2
-Terres
Land
6080 m2
-Landes
/Pâture plantée
Land
2657 m2
-Terres
2024-06-04
160 000 
1 151  /m²(139 m²)
Sale
Houses
House
9 rooms
139 m2
Land
910 m2
-Sols
2024-05-27
53 750 
452  /m²(119 m²)
Sale
Houses
House
4 rooms
119 m2
3 outbuildings
Land
1347 m2
-Terres
Land
870 m2
-Sols
Land
590 m2
-Jardins
2024-03-20
65 000 
Sale
2024-03-18
390 000 
3 939  /m²(99 m²)
Sale
Houses
House
5 rooms
99 m2
Land
500 m2
-Sols
Land
605 m2
-Terrains d'agrément
Land
1994 m2
-Terrains d'agrément
Land
98 m2
-Sols
2024-03-11
185 000 
Sale
Commercial property
Land
20455 m2
-Landes
/Pâture plantée
2024-02-02
135 000 
2 250  /m²(60 m²)
Sale
Houses
House
3 rooms
60 m2
1 outbuilding
Land
590 m2
-Sols
Land
1729 m2
-Prés
2023-12-19
287 000 
2 657  /m²(108 m²)
Sale
Houses
House
5 rooms
108 m2
2 outbuildings
Land
1059 m2
-Sols
229 transactions listed in the municipality

Drôme (26)

Most expensive cities

City
name
Descending orderHouses
house
Price per m²
3 880 
3 722 
3 404 
3 368 
3 361 
3 333 
3 314 
City
name
Descending orderApartments
apt.
Price per m²
9 900 
4 407 
3 265 
3 044 
2 987 
2 905 
2 872 

Least expensive cities

City
name
Ascending orderHouses
house
Price per m²
604 
769 
918 
1 000 
1 042 
1 058 
1 102 
1 120 
City
name
Ascending orderApartments
apt.
Price per m²
189 
303 
500 
583 
710 
718