emooki
HomePrice mapTransactions
🇬🇧 English🇫🇷 Français🇩🇪 Deutsch🇪🇸 Español🇮🇹 Italiano

Real estate price map


Real estate price map in the municipality of Grane, choose a section to see transactions by parcel.

Drôme (26)

Grane - Real estate price m²

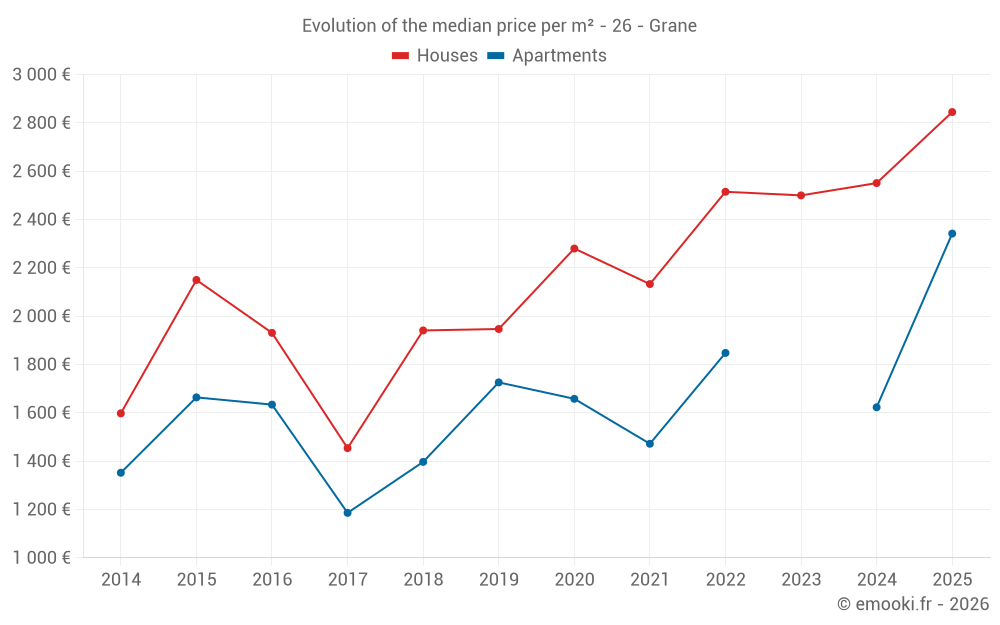
Median price of real estate
in the municipality of Grane

HousesHouses
2 742  /m²
1-23-45-67-89-10
Reliability 8/10
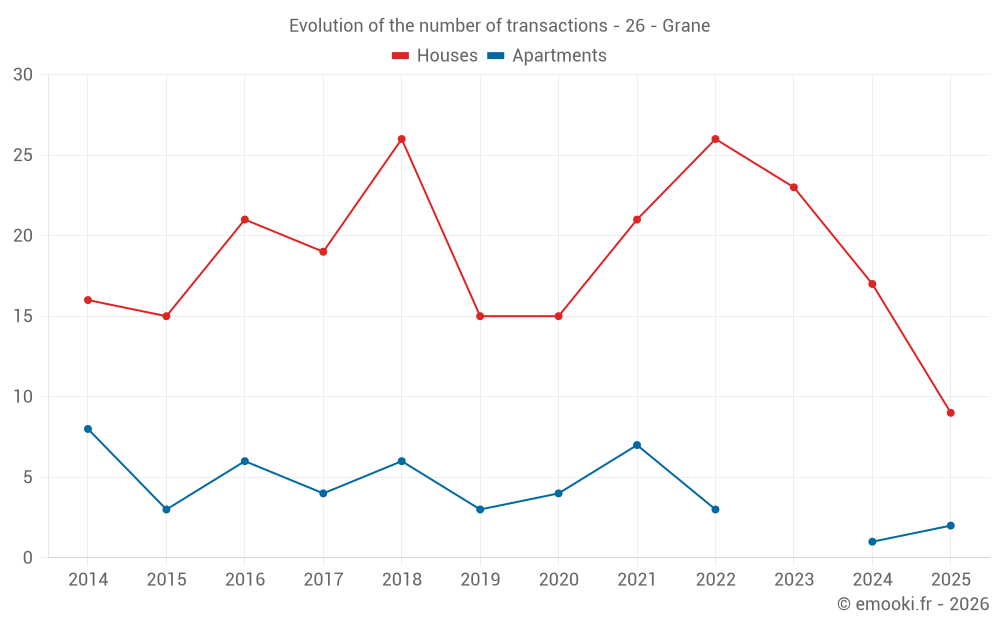
Median price on the 18 transactions of the last 12 months.
from 1 858 to
3 563  /m²
60% of transactions from the 2nd to the 8th deciles.
ApartmentsApartments
1 584  /m²
1-23-45-67-89-10
Reliability 4/10
Median price on the 16 transactions of the last 60 months.
from 1 326 to
1 942  /m²
60% of transactions from the 2nd to the 8th deciles.
DwellingsDwellings
2 740  /m²
1-23-45-67-89-10
Reliability 8/10
Median price on the 20 transactions of the last 12 months.
from 1 877 to
3 521  /m²
60% of transactions from the 2nd to the 8th deciles.
HousesEvolution of the price per m² of houses since...
1 year
+12%
2 years
+14%
3 years
+13%
4 years
+33%
5 years
+25%
6 years
+46%
7 years
+47%
8 years
+96%
9 years
+47%
10 years
+32%
11 years
+78%

Yearly evolution

Evolution of the median price per m²

Evolution of the median price per m² - 26 - Grane

Evolution of the number of transactions

Warning, last year incomplete. Projections made based on the proportions between semesters of the previous year at the departmental/national level and by type of property.

Evolution of the number of transactions - 26 - Grane

Yearly data

Descending order
Year
Houses
house
transactions
Houses
house
Price per m²
Apartments
apt.
transactions
Apartments
apt.
Price per m²
2025
9
2 845 
2
2 342 
2024
17
2 551 
1
1 623 
2023
23
2 500 
0
--- 
2022
26
2 515 
3
1 848 
2021
21
2 133 
7
1 472 
2020
15
2 280 
4
1 658 
2019
15
1 947 
3
1 726 
2018
26
1 941 
6
1 397 
2017
19
1 454 
4
1 186 
2016
21
1 931 
6
1 634 
2015
15
2 150 
3
1 664 
2014
16
1 598 
8
1 352 

Analysis

Structure of prices per m²

Values of price percentiles per m² over the periods used for the estimated price of each type of property.

Structure of transaction amounts

Values of transaction amounts percentiles over the periods used for the estimated price of each type of property.

Transaction amounts and prices per m² by percentile

Ascending order
Percentile
Houses
house
Price per m²
Houses
house
Transaction amount
Apartments
apt.
Price per m²
Apartments
apt.
Transaction amount
10th percentile
1 460 
197 K
1 114 
78 450 
20th percentile
1 858 
211 K
1 326 
109 K
30th percentile
2 280 
226 K
1 440 
128 K
40th percentile
2 577 
232 K
1 474 
140 K
50th percentile
2 742 
250 K
1 584 
172 K
60th percentile
2 879 
270 K
1 669 
180 K
70th percentile
3 094 
279 K
1 831 
221 K
80th percentile
3 563 
282 K
1 942 
250 K
90th percentile
3 903 
376 K
2 106 
269 K

National and departmental comparison

Evolution of the median price per m² of houses

Evolution of the median price per m² of apartments

Quarterly evolution

Evolution of the median price per m²

Evolution of the number of transactions

Quarterly data

Descending order
Quarter
Houses
house
transactions
Houses
house
Price per m²
Apartments
apt.
transactions
Apartments
apt.
Price per m²
2025 Q2
3
2 845 
1
2 743 
2025 Q1
6
2 924 
1
1 942 
2024 Q4
4
2 480 
0
--- 
2024 Q3
5
2 547 
0
--- 
2024 Q2
4
2 756 
0
--- 
2024 Q1
4
2 208 
1
1 623 
2023 Q4
6
2 854 
0
--- 
2023 Q3
3
2 500 
0
--- 
2023 Q2
6
3 188 
0
--- 
2023 Q1
8
868 
0
--- 
2022 Q4
6
2 544 
1
1 848 
2022 Q3
5
2 547 
1
2 143 
2022 Q2
8
2 506 
1
1 167 
2022 Q1
7
2 360 
0
--- 
2021 Q4
2
2 330 
2
1 227 
2021 Q3
9
2 133 
1
1 669 
2021 Q2
4
1 955 
2
1 399 
2021 Q1
6
2 613 
2
1 303 
2020 Q4
7
2 297 
2
1 611 
2020 Q3
2
698 
1
2 069 
2020 Q2
3
2 333 
1
1 503 
2020 Q1
3
2 280 
0
--- 
2019 Q4
3
2 270 
1
1 397 
2019 Q3
4
1 800 
0
--- 
2019 Q2
3
2 156 
0
--- 
2019 Q1
5
1 310 
2
1 854 
2018 Q4
4
1 959 
1
1 305 
2018 Q3
7
1 855 
2
1 343 
2018 Q2
8
1 868 
1
1 859 
2018 Q1
7
1 947 
2
1 876 
2017 Q4
5
1 725 
1
789 
2017 Q3
4
1 330 
3
1 222 
2017 Q2
4
1 560 
0
--- 
2017 Q1
6
1 122 
0
--- 
2016 Q4
5
1 647 
0
--- 
2016 Q3
8
1 876 
3
1 819 
2016 Q2
5
2 043 
2
1 555 
2016 Q1
3
2 013 
1
1 625 
2015 Q4
6
2 480 
1
2 117 
2015 Q3
3
1 284 
0
--- 
2015 Q2
4
2 561 
1
1 664 
2015 Q1
2
966 
1
674 
2014 Q4
1
2 700 
2
2 022 
2014 Q3
5
1 022 
2
1 864 
2014 Q2
6
2 006 
2
848 
2014 Q1
4
1 510 
2
962 

Overview of the latest real estate transactions

The following list is an anonymized overview of the latest transactions. For more details and to find all transactions, please use the map to view transactions by plot or the transaction search page for a search by criteria.

2025-05-26
199 000 
2 584  /m²(77 m²)
Sale
Houses
House
4 rooms
77 m2
Land
398 m2
-Sols
2025-05-23
367 000 
2 845  /m²(129 m²)
Sale
Houses
House
5 rooms
129 m2
1 outbuilding
Land
800 m2
-Sols
Land
650 m2
-Terres
2025-05-23
396 600 
3 605  /m²(110 m²)
Sale
Houses
House
4 rooms
110 m2
Land
892 m2
-Sols
Land
216 m2
-Sols
2025-05-12
1 400 
Sale
Land
1452 m2
-Terres
2025-05-07
65 162 
Sale
Land
1386 m2
-Terrains à bâtir
2025-04-18
1 880 
Sale
Land
6270 m2
-Terres
2025-04-16
260 600 
2 743  /m²(95 m²)
Sale
Apartments
Apartment
2 rooms
44 m2
Apartments
Apartment
2 rooms
51 m2
2025-04-08
38 000 
Sale
Land
6970 m2
-Terres
Land
40825 m2
-Taillis simples
Land
1904 m2
-Terres
Land
2536 m2
-Terres
2025-03-21
232 750 
3 103  /m²(75 m²)
Sale
Houses
House
3 rooms
75 m2
1 outbuilding
Land
660 m2
-Sols
2025-03-14
300 000 
1 240  /m²(242 m²)
1 604  /m²(187 m²)
Sale
Houses
House
4 rooms
187 m2
Commercial property
55 m2
Land
343 m2
-Sols
Land
305 m2
-Sols
Land
2000 m2
-Terres
Land
116 m2
-Sols
Land
40 m2
-Sols
Land
201 m2
-Sols
2025-02-19
252 500 
2 745  /m²(92 m²)
Sale
Houses
House
4 rooms
92 m2
Land
373 m2
-Sols
2025-02-07
87 400 
1 942  /m²(45 m²)
Sale
Apartments
Apartment
2 rooms
45 m2
1 outbuilding
2025-02-05
1 400 
Sale
Land
1405 m2
-Terres
2025-01-28
248 000 
3 647  /m²(68 m²)
Sale
Land
36 m2
-Terrains à bâtir
Houses
House
4 rooms
68 m2
Land
173 m2
-Terrains à bâtir
2025-01-28
797 000 
5 860  /m²(136 m²)
Sale
Houses
House
3 rooms
50 m2
Land
70 m2
-Sols
Houses
House
3 rooms
86 m2
Land
330 m2
-Sols
Land
1790 m2
-Landes
/Pâture plantée
Land
11170 m2
-Terres
Land
40 m2
-Sols
Land
255 m2
-Landes
/Pâture plantée
Land
65 m2
-Sols
Land
95 m2
-Sols
Land
280 m2
-Sols
Land
1659 m2
-Sols
Land
532 m2
-Landes
/Pâture plantée
Land
801 m2
-Taillis simples
2025-01-22
220 557 
1 598  /m²(138 m²)
Sale
Houses
House
4 rooms
138 m2
2025-01-16
225 000 
2 250  /m²(100 m²)
Sale
Houses
House
3 rooms
100 m2
Land
350 m2
-Sols
Land
2150 m2
-Terres
2024-12-20
240 000 
Sale
Land
356 m2
-Terrains à bâtir
2024-12-18
70 000 
467  /m²(150 m²)
Sale
Commercial property
150 m2
Land
95 m2
-Sols
2024-12-18
193 342 
1 137  /m²(170 m²)
Sale
Houses
House
5 rooms
170 m2
Land
116 m2
-Sols
Land
732 m2
-Sols
Land
94 m2
-Sols
Land
50 m2
-Terres
Land
566 m2
-Sols
Land
16 m2
-Sols
578 transactions listed in the municipality

Drôme (26)

Most expensive cities

City
name
Descending orderHouses
house
Price per m²
3 880 
3 722 
3 404 
3 368 
3 361 
3 333 
3 314 
City
name
Descending orderApartments
apt.
Price per m²
9 900 
4 407 
3 265 
3 044 
2 987 
2 905 
2 872 

Least expensive cities

City
name
Ascending orderHouses
house
Price per m²
604 
769 
918 
1 000 
1 042 
1 058 
1 102 
1 120 
City
name
Ascending orderApartments
apt.
Price per m²
189 
303 
500 
583 
710 
718