Median price of real estate
in the municipality of Étoile-sur-Rhône
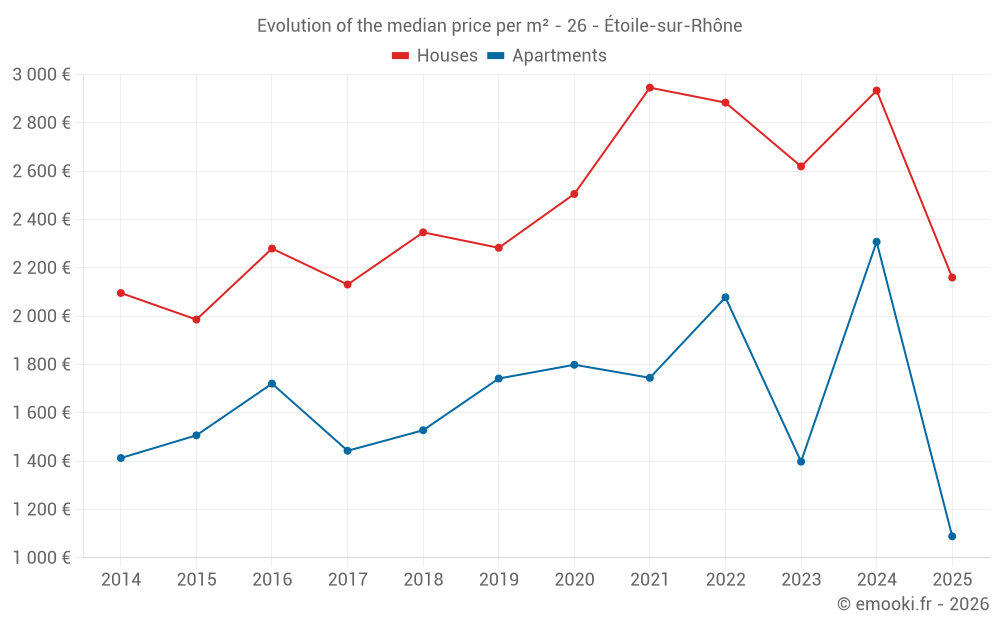
Houses
2 587 € /m²
Reliability 8/10
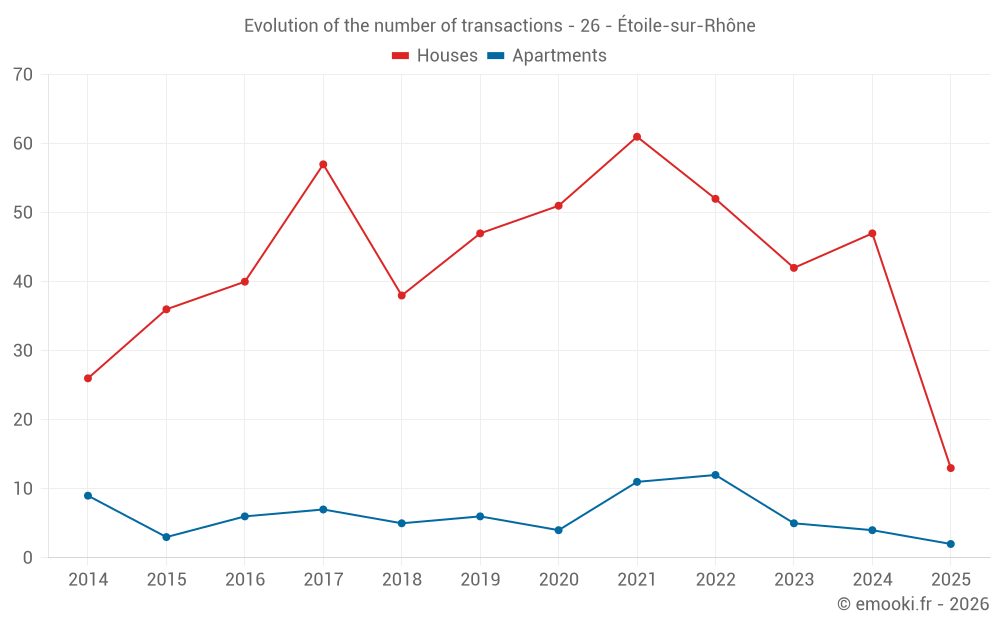
Median price on the 42 transactions of the last 12 months.
from 1 803 to
3 119 € /m²
3 119 € /m²
60% of transactions from the 2nd to the 8th deciles.
Apartments
1 973 € /m²
Reliability 6/10
Median price on the 20 transactions of the last 36 months.
from 1 297 to
2 710 € /m²
2 710 € /m²
60% of transactions from the 2nd to the 8th deciles.
Dwellings
2 530 € /m²
Reliability 8/10
Median price on the 46 transactions of the last 12 months.
from 1 539 to
3 060 € /m²
3 060 € /m²
60% of transactions from the 2nd to the 8th deciles.