emooki
HomePrice mapTransactions
🇬🇧 English🇫🇷 Français🇩🇪 Deutsch🇪🇸 Español🇮🇹 Italiano

Real estate price map


Real estate price map in the municipality of Clérieux.

Drôme (26)
Clérieux

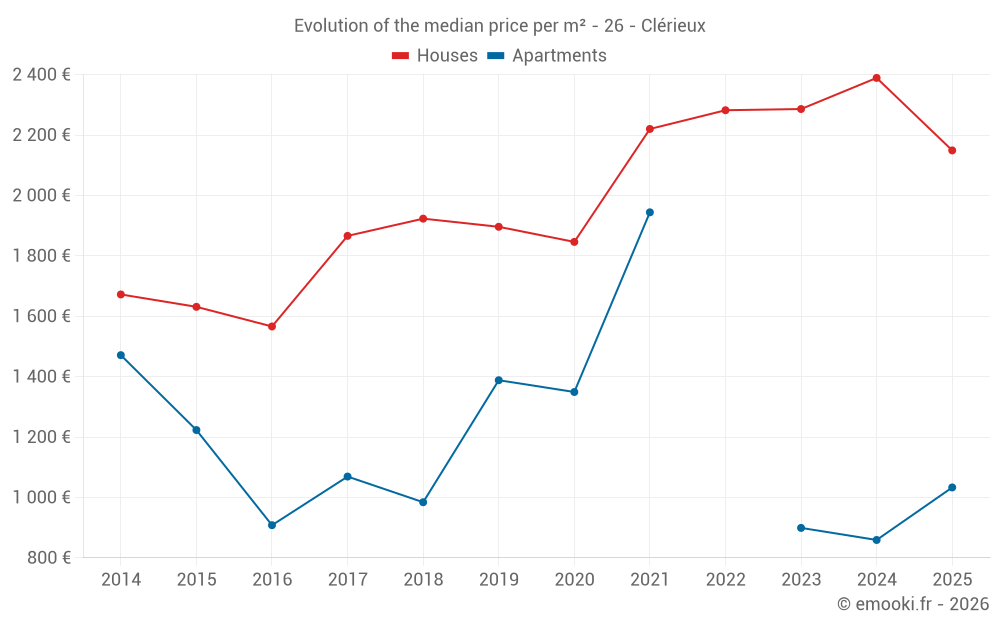
Median price of real estate
in the municipality of Clérieux

HousesHouses
2 149  /m²
1-23-45-67-89-10
Reliability 9/10
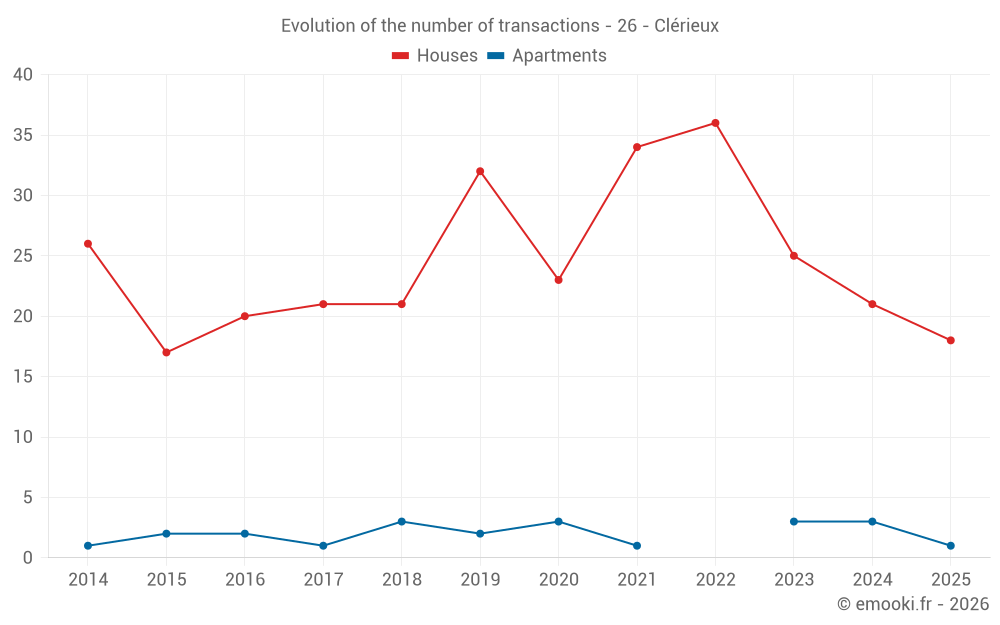
Median price on the 18 transactions of the last 6 months.
from 1 483 to
2 671  /m²
60% of transactions from the 2nd to the 8th deciles.
ApartmentsApartments
1 119  /m²
1-23-45-67-89-10
Reliability 4/10
Median price on the 11 transactions of the last 60 months.
from 883 to
1 658  /m²
60% of transactions from the 2nd to the 8th deciles.
DwellingsDwellings
2 145  /m²
1-23-45-67-89-10
Reliability 9/10
Median price on the 19 transactions of the last 6 months.
from 1 424 to
2 642  /m²
60% of transactions from the 2nd to the 8th deciles.
HousesEvolution of the price per m² of houses since...
1 year
-10%
2 years
-6%
3 years
-5.8%
4 years
-3.2%
5 years
+16%
6 years
+13%
7 years
+12%
8 years
+15%
9 years
+37%
10 years
+32%
11 years
+29%
ApartmentsEvolution of the price per m² of apartments since...
1 year
--
2 years
--
3 years
--
4 years
--
5 years
--
6 years
--
7 years
--
8 years
--
9 years
--
10 years
--
11 years
--

Yearly evolution

Evolution of the median price per m²

Evolution of the number of transactions

Warning, last year incomplete. Projections made based on the proportions between semesters of the previous year at the departmental/national level and by type of property.

Yearly data

Descending order
Year
Houses
house
transactions
Houses
house
Price per m²
Apartments
apt.
transactions
Apartments
apt.
Price per m²
2025
18
2 149 
1
1 033 
2024
21
2 389 
3
859 
2023
25
2 286 
3
899 
2022
36
2 282 
0
--- 
2021
34
2 220 
1
1 944 
2020
23
1 846 
3
1 349 
2019
32
1 896 
2
1 388 
2018
21
1 923 
3
984 
2017
21
1 866 
1
1 069 
2016
20
1 566 
2
908 
2015
17
1 631 
2
1 223 
2014
26
1 672 
1
1 471 

Analysis

Structure of prices per m²

Values of price percentiles per m² over the periods used for the estimated price of each type of property.

Structure of transaction amounts

Values of transaction amounts percentiles over the periods used for the estimated price of each type of property.

Transaction amounts and prices per m² by percentile

Ascending order
Percentile
Houses
house
Price per m²
Houses
house
Transaction amount
Apartments
apt.
Price per m²
Apartments
apt.
Transaction amount
10th percentile
1 261 
82 430 
859 
87 000 
20th percentile
1 483 
124 K
883 
95 000 
30th percentile
1 641 
160 K
899 
98 000 
40th percentile
1 791 
169 K
1 033 
112 K
50th percentile
2 149 
212 K
1 119 
144 K
60th percentile
2 294 
253 K
1 349 
170 K
70th percentile
2 490 
266 K
1 441 
173 K
80th percentile
2 671 
303 K
1 658 
175 K
90th percentile
2 760 
330 K
1 944 
189 K

National and departmental comparison

Evolution of the median price per m² of houses

Evolution of the median price per m² of apartments

Quarterly evolution

Evolution of the median price per m²

Evolution of the number of transactions

Quarterly data

Descending order
Quarter
Houses
house
transactions
Houses
house
Price per m²
Apartments
apt.
transactions
Apartments
apt.
Price per m²
2025 Q2
12
1 791 
1
1 033 
2025 Q1
6
2 542 
0
--- 
2024 Q4
6
2 528 
0
--- 
2024 Q3
7
2 563 
3
859 
2024 Q2
4
2 197 
0
--- 
2024 Q1
4
1 992 
0
--- 
2023 Q4
4
2 240 
0
--- 
2023 Q3
8
2 170 
1
899 
2023 Q2
6
2 424 
1
883 
2023 Q1
7
2 286 
1
1 658 
2022 Q4
10
2 286 
0
--- 
2022 Q3
14
2 286 
0
--- 
2022 Q2
9
2 290 
0
--- 
2022 Q1
3
1 567 
0
--- 
2021 Q4
9
2 201 
1
1 944 
2021 Q3
15
2 224 
0
--- 
2021 Q2
7
2 133 
0
--- 
2021 Q1
3
2 487 
0
--- 
2020 Q4
6
1 820 
1
2 175 
2020 Q3
3
2 679 
2
1 234 
2020 Q2
6
1 914 
0
--- 
2020 Q1
8
1 857 
0
--- 
2019 Q4
5
2 551 
0
--- 
2019 Q3
11
1 896 
0
--- 
2019 Q2
6
1 326 
1
1 620 
2019 Q1
10
1 950 
1
1 156 
2018 Q4
6
1 786 
2
1 124 
2018 Q3
5
2 005 
0
--- 
2018 Q2
4
1 888 
1
571 
2018 Q1
6
1 920 
0
--- 
2017 Q4
4
2 382 
0
--- 
2017 Q3
7
1 669 
1
1 069 
2017 Q2
5
1 848 
0
--- 
2017 Q1
5
2 309 
0
--- 
2016 Q4
3
2 089 
1
861 
2016 Q3
6
1 566 
0
--- 
2016 Q2
8
1 117 
1
955 
2016 Q1
3
1 634 
0
--- 
2015 Q4
7
1 546 
1
1 507 
2015 Q3
5
1 637 
1
939 
2015 Q2
4
1 437 
0
--- 
2015 Q1
1
1 467 
0
--- 
2014 Q4
7
1 718 
0
--- 
2014 Q3
10
1 597 
1
1 471 
2014 Q2
6
1 527 
0
--- 
2014 Q1
3
1 632 
0
--- 

Drôme (26)

Most expensive cities

City
name
Descending orderHouses
house
Price per m²
3 880 
3 722 
3 404 
3 368 
3 361 
3 333 
3 314 
City
name
Descending orderApartments
apt.
Price per m²
9 900 
4 407 
3 265 
3 044 
2 987 
2 905 
2 872 

Least expensive cities

City
name
Ascending orderHouses
house
Price per m²
604 
769 
918 
1 000 
1 042 
1 058 
1 102 
1 120 
City
name
Ascending orderApartments
apt.
Price per m²
189 
303 
500 
583 
710 
718