emooki
HomePrice mapTransactions
🇬🇧 English🇫🇷 Français🇩🇪 Deutsch🇪🇸 Español🇮🇹 Italiano

Real estate price map


Real estate price map in the municipality of Châteauneuf-de-Galaure.

Drôme (26)
Châteauneuf-de-Galaure

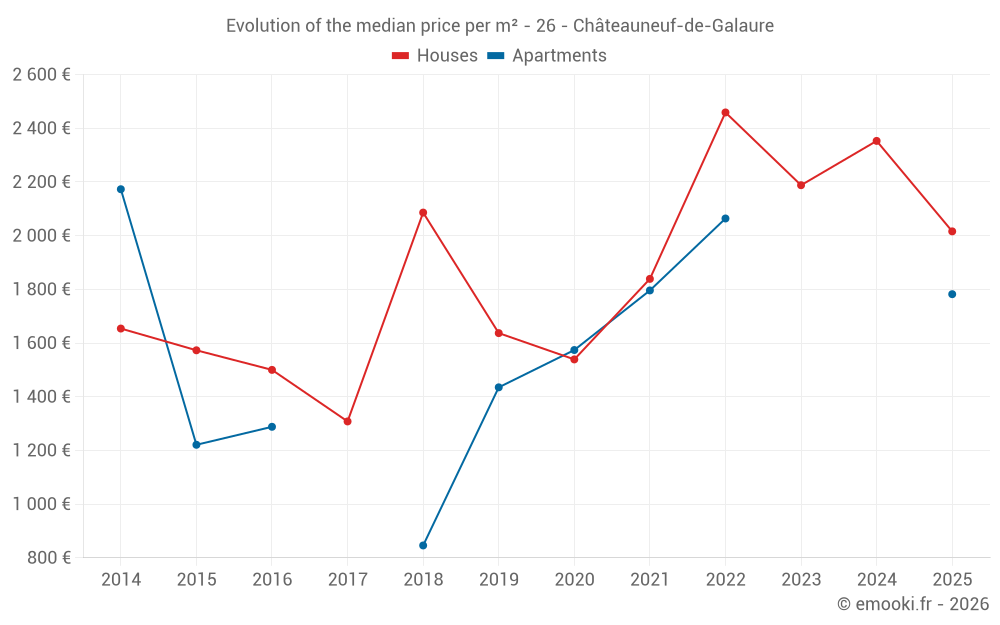
Median price of real estate
in the municipality of Châteauneuf-de-Galaure

HousesHouses
2 353  /m²
1-23-45-67-89-10
Reliability 7/10
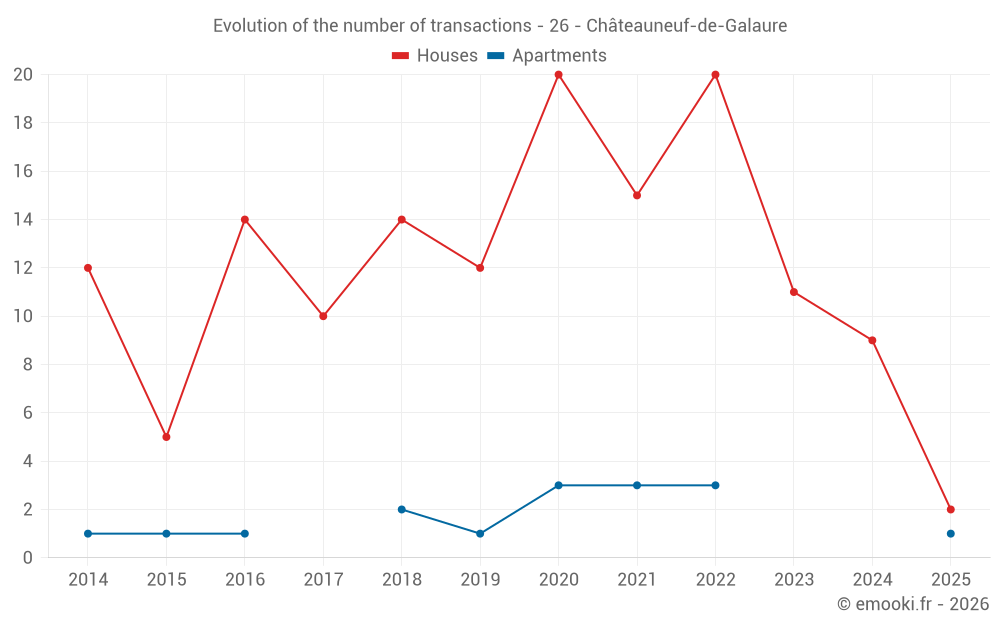
Median price on the 15 transactions of the last 24 months.
from 1 879 to
2 717  /m²
60% of transactions from the 2nd to the 8th deciles.
ApartmentsApartments
1 789  /m²
1-23-45-67-89-10
Reliability 4/10
Median price on the 8 transactions of the last 60 months.
DwellingsDwellings
2 270  /m²
1-23-45-67-89-10
Reliability 7/10
Median price on the 16 transactions of the last 24 months.
from 1 782 to
2 712  /m²
60% of transactions from the 2nd to the 8th deciles.
HousesEvolution of the price per m² of houses since...
1 year
--
2 years
--
3 years
--
4 years
--
5 years
--
6 years
--
7 years
--
8 years
--
9 years
--
10 years
--
11 years
--
ApartmentsEvolution of the price per m² of apartments since...
1 year
--
2 years
--
3 years
--
4 years
--
5 years
--
6 years
--
7 years
--
8 years
--
9 years
--
10 years
--
11 years
--

Yearly evolution

Evolution of the median price per m²

Evolution of the number of transactions

Warning, last year incomplete. Projections made based on the proportions between semesters of the previous year at the departmental/national level and by type of property.

Yearly data

Descending order
Year
Houses
house
transactions
Houses
house
Price per m²
Apartments
apt.
transactions
Apartments
apt.
Price per m²
2025
2
2 016 
1
1 782 
2024
9
2 353 
0
--- 
2023
11
2 188 
0
--- 
2022
20
2 459 
3
2 064 
2021
15
1 839 
3
1 796 
2020
20
1 539 
3
1 574 
2019
12
1 637 
1
1 435 
2018
14
2 086 
2
846 
2017
10
1 308 
0
--- 
2016
14
1 500 
1
1 288 
2015
5
1 573 
1
1 221 
2014
12
1 654 
1
2 173 

Analysis

Structure of prices per m²

Values of price percentiles per m² over the periods used for the estimated price of each type of property.

Structure of transaction amounts

Values of transaction amounts percentiles over the periods used for the estimated price of each type of property.

Transaction amounts and prices per m² by percentile

Ascending order
Percentile
Houses
house
Price per m²
Houses
house
Transaction amount
Apartments
apt.
Price per m²
Apartments
apt.
Transaction amount
10th percentile
1 522 
114 K
969 
87 400 
20th percentile
1 879 
127 K
1 384 
111 K
30th percentile
1 985 
167 K
1 757 
129 K
40th percentile
2 138 
209 K
1 776 
134 K
50th percentile
2 353 
220 K
1 789 
147 K
60th percentile
2 523 
246 K
1 850 
160 K
70th percentile
2 632 
268 K
2 037 
163 K
80th percentile
2 717 
274 K
2 255 
164 K
90th percentile
2 746 
302 K
2 536 
171 K

National and departmental comparison

Evolution of the median price per m² of houses

Evolution of the median price per m² of apartments

Quarterly evolution

Evolution of the median price per m²

Evolution of the number of transactions

Quarterly data

Descending order
Quarter
Houses
house
transactions
Houses
house
Price per m²
Apartments
apt.
transactions
Apartments
apt.
Price per m²
2025 Q2
1
1 467 
1
1 782 
2025 Q1
1
2 566 
0
--- 
2024 Q4
3
2 649 
0
--- 
2024 Q3
3
2 494 
0
--- 
2024 Q2
2
2 208 
0
--- 
2024 Q1
1
1 947 
0
--- 
2023 Q4
1
1 605 
0
--- 
2023 Q3
3
2 738 
0
--- 
2023 Q2
5
1 870 
0
--- 
2023 Q1
2
1 972 
0
--- 
2022 Q4
4
3 086 
1
578 
2022 Q3
4
2 704 
1
2 892 
2022 Q2
5
2 240 
0
--- 
2022 Q1
7
2 337 
1
2 064 
2021 Q4
5
1 593 
1
1 796 
2021 Q3
9
2 206 
1
1 137 
2021 Q2
1
821 
0
--- 
2021 Q1
0
--- 
1
2 383 
2020 Q4
5
1 544 
1
1 754 
2020 Q3
7
1 596 
0
--- 
2020 Q2
6
1 247 
0
--- 
2020 Q1
2
2 028 
2
1 492 
2019 Q4
3
2 316 
0
--- 
2019 Q3
1
1 471 
0
--- 
2019 Q2
6
1 610 
0
--- 
2019 Q1
2
1 772 
1
1 435 
2018 Q4
5
1 974 
0
--- 
2018 Q3
4
2 210 
0
--- 
2018 Q2
3
3 000 
1
873 
2018 Q1
2
1 342 
1
819 
2017 Q4
1
1 118 
0
--- 
2017 Q3
3
1 512 
0
--- 
2017 Q2
3
1 244 
0
--- 
2017 Q1
3
1 168 
0
--- 
2016 Q4
2
1 566 
0
--- 
2016 Q3
2
1 766 
1
1 288 
2016 Q2
7
1 471 
0
--- 
2016 Q1
3
1 863 
0
--- 
2015 Q4
2
1 180 
0
--- 
2015 Q3
1
2 542 
1
1 221 
2015 Q1
2
1 208 
0
--- 
2014 Q4
4
1 256 
0
--- 
2014 Q3
5
1 680 
0
--- 
2014 Q1
3
1 775 
1
2 173 

Drôme (26)

Most expensive cities

City
name
Descending orderHouses
house
Price per m²
3 880 
3 722 
3 404 
3 368 
3 361 
3 333 
3 314 
City
name
Descending orderApartments
apt.
Price per m²
9 900 
4 407 
3 265 
3 044 
2 987 
2 905 
2 872 

Least expensive cities

City
name
Ascending orderHouses
house
Price per m²
604 
769 
918 
1 000 
1 042 
1 058 
1 102 
1 120 
City
name
Ascending orderApartments
apt.
Price per m²
189 
303 
500 
583 
710 
718