emooki
HomePrice mapTransactions
🇬🇧 English🇫🇷 Français🇩🇪 Deutsch🇪🇸 Español🇮🇹 Italiano

Real estate price map


Real estate price map in the municipality of Bourg-de-Péage.

Drôme (26)
Bourg-de-Péage

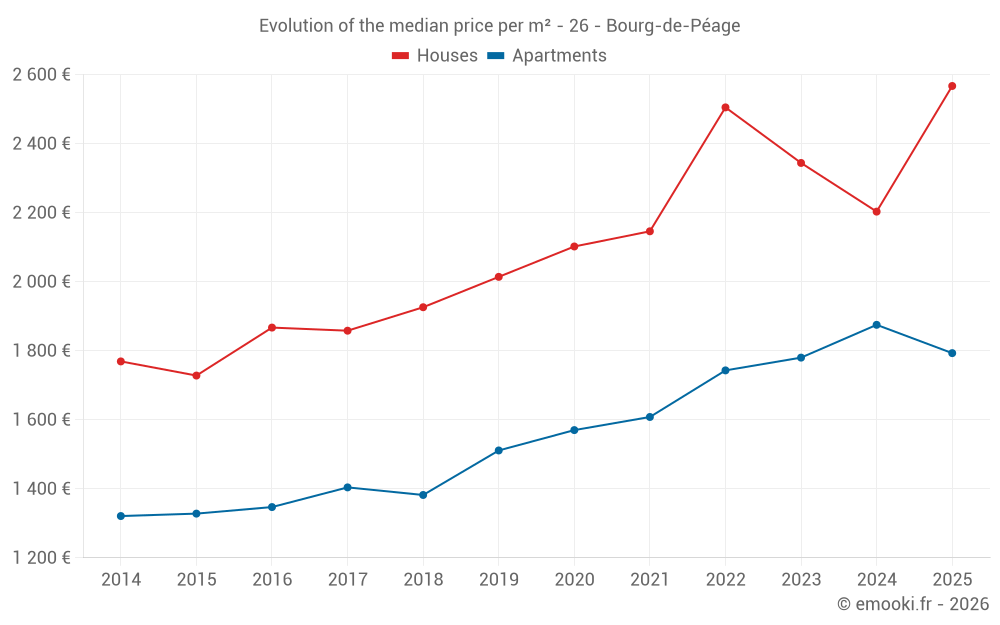
Median price of real estate
in the municipality of Bourg-de-Péage

HousesHouses
2 567  /m²
1-23-45-67-89-10
Reliability 9/10
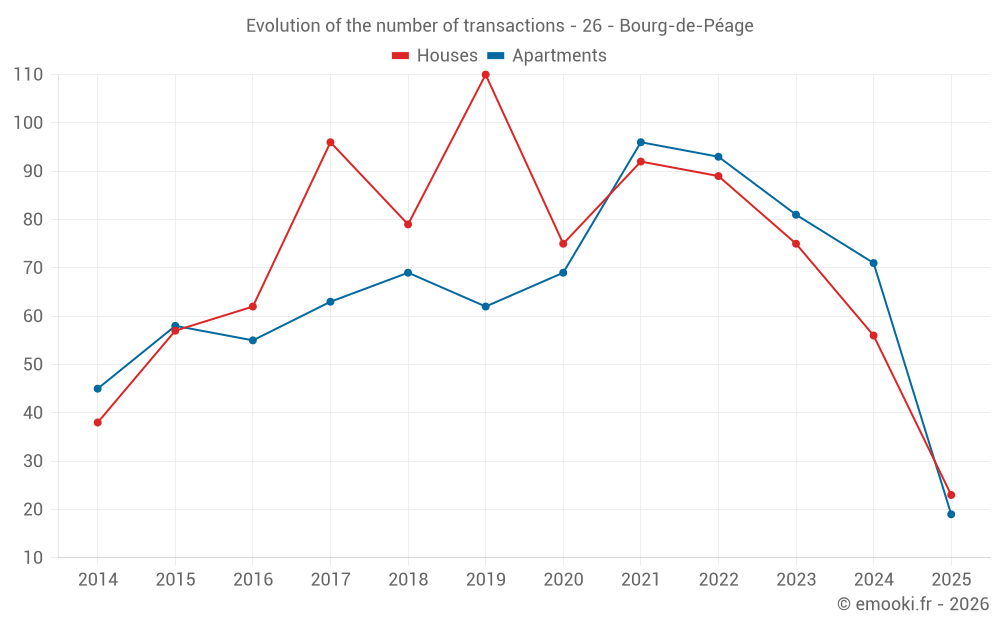
Median price on the 23 transactions of the last 6 months.
from 1 728 to
2 797  /m²
60% of transactions from the 2nd to the 8th deciles.
ApartmentsApartments
1 793  /m²
1-23-45-67-89-10
Reliability 9/10
Median price on the 19 transactions of the last 6 months.
from 1 089 to
2 321  /m²
60% of transactions from the 2nd to the 8th deciles.
DwellingsDwellings
1 939  /m²
1-23-45-67-89-10
Reliability 10/10
Median price on the 22 transactions of the last 3 months.
from 1 178 to
2 634  /m²
60% of transactions from the 2nd to the 8th deciles.
HousesEvolution of the price per m² of houses since...
1 year
+17%
2 years
+10%
3 years
+2.5%
4 years
+20%
5 years
+22%
6 years
+27%
7 years
+33%
8 years
+38%
9 years
+37%
10 years
+49%
11 years
+45%
ApartmentsEvolution of the price per m² of apartments since...
1 year
-4.4%
2 years
+0.7%
3 years
+2.9%
4 years
+12%
5 years
+14%
6 years
+19%
7 years
+30%
8 years
+28%
9 years
+33%
10 years
+35%
11 years
+36%

Yearly evolution

Evolution of the median price per m²

Evolution of the number of transactions

Warning, last year incomplete. Projections made based on the proportions between semesters of the previous year at the departmental/national level and by type of property.

Yearly data

Descending order
Year
Houses
house
transactions
Houses
house
Price per m²
Apartments
apt.
transactions
Apartments
apt.
Price per m²
2025
23
2 567 
19
1 793 
2024
56
2 203 
71
1 875 
2023
75
2 344 
81
1 780 
2022
89
2 505 
93
1 743 
2021
92
2 146 
96
1 608 
2020
75
2 102 
69
1 570 
2019
110
2 014 
62
1 511 
2018
79
1 926 
69
1 382 
2017
96
1 858 
63
1 404 
2016
62
1 867 
55
1 347 
2015
57
1 728 
58
1 328 
2014
38
1 769 
45
1 321 

Analysis

Structure of prices per m²

Values of price percentiles per m² over the periods used for the estimated price of each type of property.

Structure of transaction amounts

Values of transaction amounts percentiles over the periods used for the estimated price of each type of property.

Transaction amounts and prices per m² by percentile

Ascending order
Percentile
Houses
house
Price per m²
Houses
house
Transaction amount
Apartments
apt.
Price per m²
Apartments
apt.
Transaction amount
10th percentile
1 434 
99 600 
955 
59 000 
20th percentile
1 728 
127 K
1 089 
65 600 
30th percentile
1 824 
145 K
1 458 
68 600 
40th percentile
2 305 
149 K
1 625 
76 600 
50th percentile
2 567 
185 K
1 793 
90 000 
60th percentile
2 607 
212 K
1 978 
101 K
70th percentile
2 623 
230 K
2 024 
132 K
80th percentile
2 797 
255 K
2 321 
149 K
90th percentile
2 980 
273 K
3 024 
172 K

National and departmental comparison

Evolution of the median price per m² of houses

Evolution of the median price per m² of apartments

Quarterly evolution

Evolution of the median price per m²

Evolution of the number of transactions

Quarterly data

Descending order
Quarter
Houses
house
transactions
Houses
house
Price per m²
Apartments
apt.
transactions
Apartments
apt.
Price per m²
2025 Q2
14
2 420 
8
1 460 
2025 Q1
9
2 607 
11
1 854 
2024 Q4
12
1 861 
25
1 930 
2024 Q3
16
2 462 
22
2 602 
2024 Q2
19
2 130 
10
1 650 
2024 Q1
9
2 352 
14
1 678 
2023 Q4
13
2 613 
12
1 740 
2023 Q3
24
2 331 
17
1 597 
2023 Q2
20
2 302 
29
1 973 
2023 Q1
18
2 263 
23
1 692 
2022 Q4
30
2 520 
24
1 700 
2022 Q3
26
2 420 
21
1 815 
2022 Q2
22
2 628 
22
1 650 
2022 Q1
11
2 397 
26
1 763 
2021 Q4
24
2 291 
27
1 920 
2021 Q3
27
2 120 
24
1 596 
2021 Q2
20
2 114 
22
1 410 
2021 Q1
21
2 098 
23
1 595 
2020 Q4
28
2 116 
18
1 450 
2020 Q3
19
1 853 
11
1 949 
2020 Q2
13
2 135 
19
1 500 
2020 Q1
15
2 143 
21
1 644 
2019 Q4
23
2 055 
14
1 652 
2019 Q3
28
2 172 
14
1 650 
2019 Q2
29
1 858 
18
1 476 
2019 Q1
30
1 934 
16
1 381 
2018 Q4
21
1 976 
14
1 296 
2018 Q3
26
1 746 
14
1 200 
2018 Q2
17
2 117 
23
1 379 
2018 Q1
15
1 741 
18
1 606 
2017 Q4
25
1 923 
22
1 449 
2017 Q3
28
2 050 
13
1 376 
2017 Q2
20
1 714 
15
1 524 
2017 Q1
23
1 627 
13
1 333 
2016 Q4
16
2 032 
5
1 300 
2016 Q3
15
1 719 
11
1 224 
2016 Q2
16
1 800 
20
1 388 
2016 Q1
15
1 863 
19
1 366 
2015 Q4
12
1 579 
18
1 377 
2015 Q3
15
2 063 
15
1 279 
2015 Q2
18
1 714 
18
1 362 
2015 Q1
12
1 644 
7
1 182 
2014 Q4
7
1 667 
13
1 321 
2014 Q3
6
2 106 
13
1 388 
2014 Q2
10
1 940 
13
1 167 
2014 Q1
15
1 667 
6
1 377 

Drôme (26)

Most expensive cities

City
name
Descending orderHouses
house
Price per m²
3 880 
3 722 
3 404 
3 368 
3 361 
3 333 
3 314 
City
name
Descending orderApartments
apt.
Price per m²
9 900 
4 407 
3 265 
3 044 
2 987 
2 905 
2 872 

Least expensive cities

City
name
Ascending orderHouses
house
Price per m²
604 
769 
918 
1 000 
1 042 
1 058 
1 102 
1 120 
City
name
Ascending orderApartments
apt.
Price per m²
189 
303 
500 
583 
710 
718