emooki
HomePrice mapTransactions
🇬🇧 English🇫🇷 Français🇩🇪 Deutsch🇪🇸 Español🇮🇹 Italiano

Real estate price map


Real estate price map in the municipality of La Bégude-de-Mazenc, choose a section to see transactions by parcel.

Drôme (26)
La Bégude-de-Mazenc

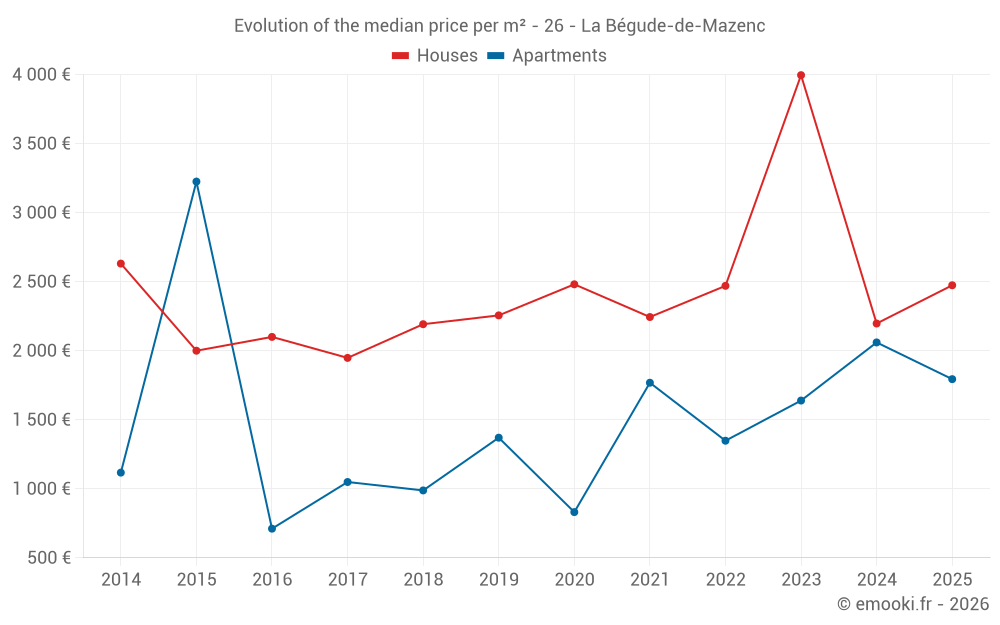
Median price of real estate
in the municipality of La Bégude-de-Mazenc

HousesHouses
2 390  /m²
1-23-45-67-89-10
Reliability 8/10
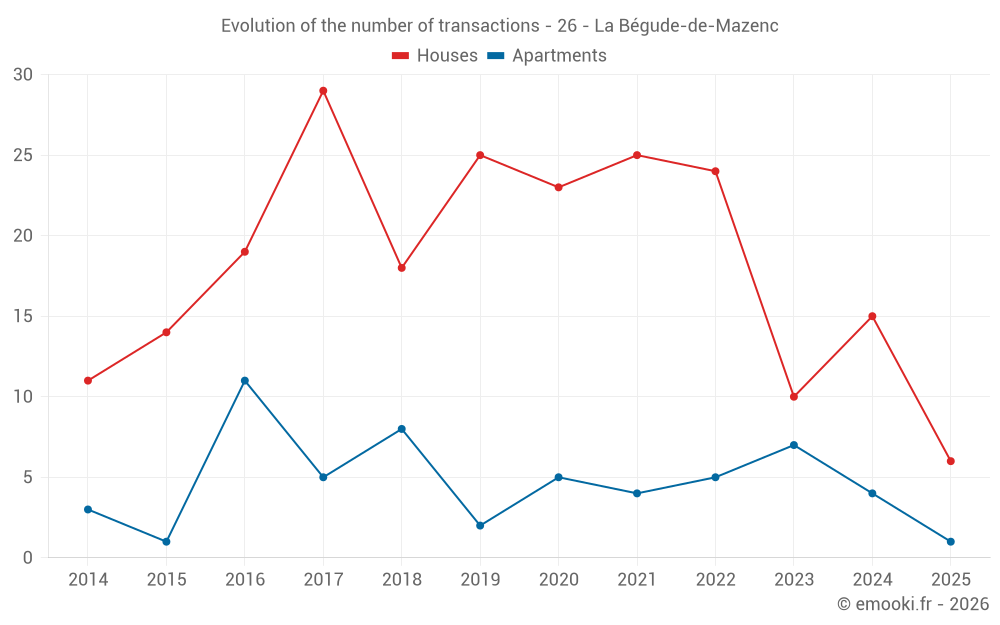
Median price on the 17 transactions of the last 12 months.
from 1 347 to
2 746  /m²
60% of transactions from the 2nd to the 8th deciles.
ApartmentsApartments
1 693  /m²
1-23-45-67-89-10
Reliability 6/10
Median price on the 15 transactions of the last 36 months.
from 1 078 to
2 001  /m²
60% of transactions from the 2nd to the 8th deciles.
DwellingsDwellings
2 316  /m²
1-23-45-67-89-10
Reliability 8/10
Median price on the 21 transactions of the last 12 months.
from 1 794 to
2 633  /m²
60% of transactions from the 2nd to the 8th deciles.
HousesEvolution of the price per m² of houses since...
1 year
+13%
2 years
-38%
3 years
+0.2%
4 years
+10%
5 years
-0.3%
6 years
+10%
7 years
+13%
8 years
+27%
9 years
+18%
10 years
+24%
11 years
-6%
The price per m² of houses has decreased by 38% since 2 years, but it has increased by 27% in 8 years.

Yearly evolution

Evolution of the median price per m²

Evolution of the number of transactions

Warning, last year incomplete. Projections made based on the proportions between semesters of the previous year at the departmental/national level and by type of property.

Yearly data

Descending order
Year
Houses
house
transactions
Houses
house
Price per m²
Apartments
apt.
transactions
Apartments
apt.
Price per m²
2025
6
2 474 
1
1 794 
2024
15
2 197 
4
2 060 
2023
10
3 996 
7
1 639 
2022
24
2 470 
5
1 348 
2021
25
2 244 
4
1 768 
2020
23
2 481 
5
831 
2019
25
2 256 
2
1 370 
2018
18
2 192 
8
988 
2017
29
1 948 
5
1 049 
2016
19
2 100 
11
711 
2015
14
2 000 
1
3 225 
2014
11
2 631 
3
1 117 

Analysis

Structure of prices per m²

Values of price percentiles per m² over the periods used for the estimated price of each type of property.

Structure of transaction amounts

Values of transaction amounts percentiles over the periods used for the estimated price of each type of property.

Transaction amounts and prices per m² by percentile

Ascending order
Percentile
Houses
house
Price per m²
Houses
house
Transaction amount
Apartments
apt.
Price per m²
Apartments
apt.
Transaction amount
10th percentile
1 012 
116 K
885 
59 200 
20th percentile
1 347 
154 K
1 078 
71 980 
30th percentile
1 930 
184 K
1 542 
81 633 
40th percentile
2 115 
226 K
1 654 
85 000 
50th percentile
2 390 
258 K
1 693 
85 000 
60th percentile
2 437 
267 K
1 794 
115 K
70th percentile
2 559 
311 K
1 801 
143 K
80th percentile
2 746 
347 K
2 001 
165 K
90th percentile
2 986 
368 K
2 264 
207 K

National and departmental comparison

Evolution of the median price per m² of houses

Evolution of the median price per m² of apartments

Quarterly evolution

Evolution of the median price per m²

Evolution of the number of transactions

Quarterly data

Descending order
Quarter
Houses
house
transactions
Houses
house
Price per m²
Apartments
apt.
transactions
Apartments
apt.
Price per m²
2025 Q2
3
2 774 
1
1 794 
2025 Q1
3
2 060 
0
--- 
2024 Q4
5
1 872 
3
2 316 
2024 Q3
6
2 544 
0
--- 
2024 Q2
4
2 372 
0
--- 
2024 Q1
0
--- 
1
1 518 
2023 Q4
2
4 401 
2
1 450 
2023 Q3
2
4 040 
2
1 581 
2023 Q2
1
2 290 
1
1 664 
2023 Q1
5
4 126 
2
1 232 
2022 Q4
5
3 115 
3
1 693 
2022 Q3
6
3 459 
0
--- 
2022 Q2
4
2 414 
1
1 348 
2022 Q1
9
2 241 
1
782 
2021 Q4
5
2 121 
3
2 016 
2021 Q3
10
2 203 
0
--- 
2021 Q2
5
2 593 
1
1 500 
2021 Q1
5
2 155 
0
--- 
2020 Q4
8
2 440 
1
1 918 
2020 Q3
8
2 648 
1
1 056 
2020 Q2
5
2 768 
1
384 
2020 Q1
2
1 638 
2
712 
2019 Q4
9
2 348 
0
--- 
2019 Q3
8
2 402 
0
--- 
2019 Q2
4
872 
1
321 
2019 Q1
4
1 002 
1
2 419 
2018 Q4
5
2 162 
4
890 
2018 Q3
6
2 060 
1
962 
2018 Q2
5
2 221 
1
1 202 
2018 Q1
2
10 558 
2
988 
2017 Q4
9
1 948 
1
1 049 
2017 Q3
13
1 814 
3
1 070 
2017 Q2
4
2 103 
0
--- 
2017 Q1
3
2 256 
1
761 
2016 Q4
2
1 966 
3
858 
2016 Q3
7
1 819 
6
679 
2016 Q2
6
2 246 
0
--- 
2016 Q1
4
2 052 
2
1 477 
2015 Q4
5
2 020 
0
--- 
2015 Q3
4
1 829 
0
--- 
2015 Q2
3
2 679 
0
--- 
2015 Q1
2
1 926 
1
3 225 
2014 Q4
2
2 909 
0
--- 
2014 Q3
4
2 430 
1
1 117 
2014 Q2
2
3 316 
1
1 304 
2014 Q1
3
1 989 
1
752 

Overview of the latest real estate transactions

The following list is an anonymized overview of the latest transactions. For more details and to find all transactions, please use the map to view transactions by plot or the transaction search page for a search by criteria.

2025-05-19
304 830 
2 540  /m²(120 m²)
Sale
Houses
House
4 rooms
120 m2
2 outbuildings
Land
224 m2
-Sols
Land
699 m2
-Terres
Land
73 m2
-Sols
2025-05-15
355 850 
2 847  /m²(125 m²)
Sale
Houses
House
5 rooms
125 m2
2 outbuildings
Land
944 m2
-Sols
2025-05-06
585 300 
2 774  /m²(211 m²)
Sale
Houses
House
4 rooms
211 m2
1 outbuilding
Land
4000 m2
-Terres
Land
1000 m2
-Sols
Land
840 m2
-Terres
Land
1155 m2
-Terres
2025-04-18
890 
Sale
Land
1777 m2
-Terres
2025-04-11
1 
Sale
Land
40 m2
-Terres
2025-04-11
1 000 
Sale
Land
366 m2
-Terres
2025-04-11
1 
Sale
Land
94 m2
-Sols
2025-04-11
1 
Sale
Land
20 m2
-Terres
Land
3 m2
-Sols
Land
2 m2
-Sols
2025-04-11
1 
Sale
Land
10 m2
-Sols
2025-04-10
1 
Sale
Land
175 m2
-Terres
Land
86 m2
-Terres
Land
218 m2
-Terres
Land
3 m2
-Terres
2025-04-10
1 
Sale
Land
56 m2
-Sols
2025-04-10
1 
Sale
Land
89 m2
-Sols
2025-04-10
300 
Exchange
Land
15 m2
-Terres
Land
7 m2
-Terres
Land
254 m2
-Sols
Land
23 m2
-Sols
2025-04-09
235 000 
1 794  /m²(131 m²)
Sale
Apartments
Apartment
3 rooms
80 m2
Apartments
Apartment
2 rooms
51 m2
3 outbuildings
Land
950 m2
-Sols
Land
2020 m2
-Terres
Land
530 m2
-Landes
/Pâture plantée
2025-03-19
693 
Sale
Land
462 m2
-Eaux
/CANAL
2025-03-17
151 702 
1 945  /m²(78 m²)
Sale
Houses
House
4 rooms
78 m2
Land
186 m2
-Sols
Land
27 m2
-Sols
2025-03-13
500 
Exchange
Land
135 m2
-Terres
Land
371 m2
-Terres
Land
265 m2
-Eaux
/CANAL
2025-03-13
100 000 
Sale
Land
503 m2
-Jardins
2025-02-28
265 000 
2 409  /m²(110 m²)
Sale
Houses
House
5 rooms
110 m2
2025-02-27
4 500 
Sale
Land
45 m2
-Sols
566 transactions listed in the municipality

Drôme (26)

Most expensive cities

City
name
Descending orderHouses
house
Price per m²
3 880 
3 722 
3 404 
3 368 
3 361 
3 333 
3 314 
City
name
Descending orderApartments
apt.
Price per m²
9 900 
4 407 
3 265 
3 044 
2 987 
2 905 
2 872 

Least expensive cities

City
name
Ascending orderHouses
house
Price per m²
604 
769 
918 
1 000 
1 042 
1 058 
1 102 
1 120 
City
name
Ascending orderApartments
apt.
Price per m²
189 
303 
500 
583 
710 
718