emooki
HomePrice mapTransactions
🇬🇧 English🇫🇷 Français🇩🇪 Deutsch🇪🇸 Español🇮🇹 Italiano

Real estate price map


Real estate price map in the municipality of Beaufort-sur-Gervanne, choose a section to see transactions by parcel.

Drôme (26)

Beaufort-sur-Gervanne - Real estate price m²

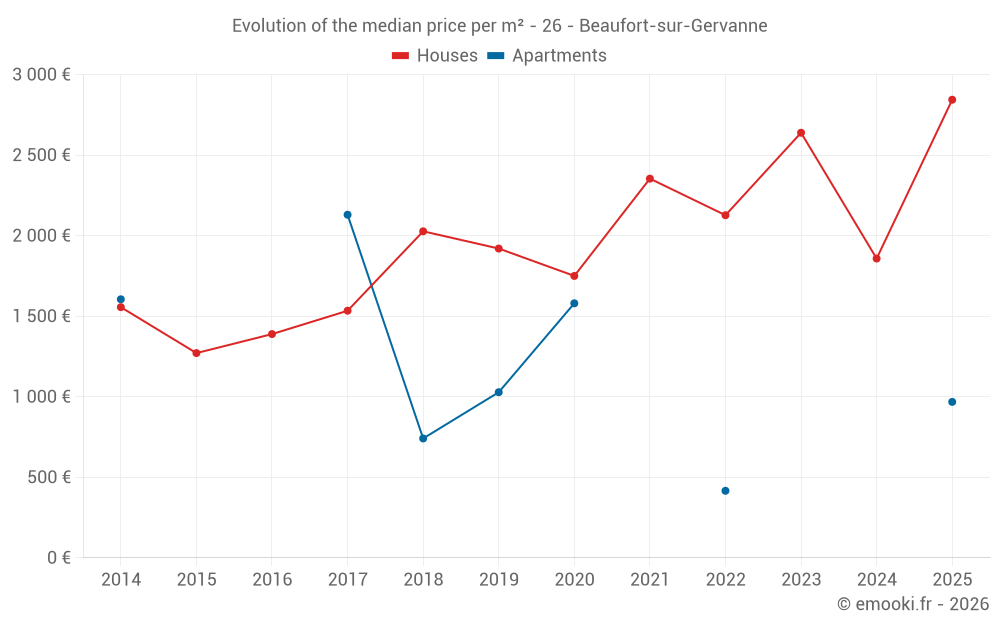
Median price of real estate
in the municipality of Beaufort-sur-Gervanne

HousesHouses
2 329  /m²
1-23-45-67-89-10
Reliability 6/10
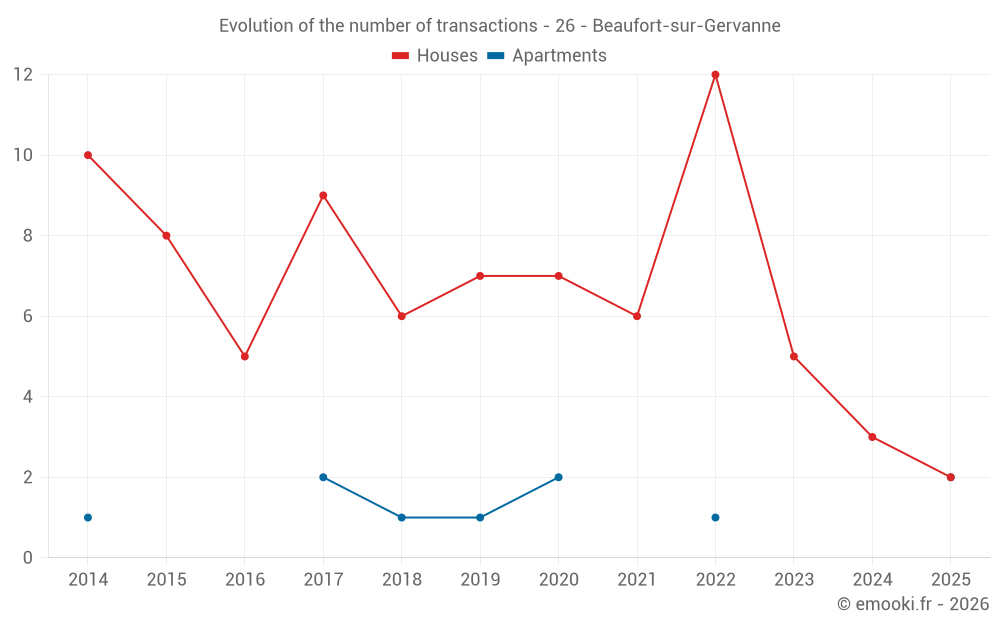
Median price on the 17 transactions of the last 36 months.
from 1 650 to
2 928  /m²
60% of transactions from the 2nd to the 8th deciles.
ApartmentsApartments
1 131  /m²
1-23-45-67-89-10
Reliability 2/10
Median price on the 8 transactions of the last 96 months.
DwellingsDwellings
2 308  /m²
1-23-45-67-89-10
Reliability 6/10
Median price on the 19 transactions of the last 36 months.
from 1 347 to
2 864  /m²
60% of transactions from the 2nd to the 8th deciles.

Yearly evolution

Evolution of the median price per m²

Evolution of the median price per m² - 26 - Beaufort-sur-Gervanne

Evolution of the number of transactions

Warning, last year incomplete. Projections made based on the proportions between semesters of the previous year at the departmental/national level and by type of property.

Evolution of the number of transactions - 26 - Beaufort-sur-Gervanne

Yearly data

Descending order
Year
Houses
house
transactions
Houses
house
Price per m²
Apartments
apt.
transactions
Apartments
apt.
Price per m²
2025
2
2 844 
2
968 
2024
3
1 858 
0
--- 
2023
5
2 639 
0
--- 
2022
12
2 127 
1
416 
2021
6
2 354 
0
--- 
2020
7
1 750 
2
1 580 
2019
7
1 920 
1
1 028 
2018
6
2 027 
1
741 
2017
9
1 534 
2
2 130 
2016
5
1 389 
0
--- 
2015
8
1 271 
0
--- 
2014
10
1 556 
1
1 605 

Analysis

Structure of prices per m²

Values of price percentiles per m² over the periods used for the estimated price of each type of property.

Structure of transaction amounts

Values of transaction amounts percentiles over the periods used for the estimated price of each type of property.

Transaction amounts and prices per m² by percentile

Ascending order
Percentile
Houses
house
Price per m²
Houses
house
Transaction amount
Apartments
apt.
Price per m²
Apartments
apt.
Transaction amount
10th percentile
1 347 
106 K
616 
65 986 
20th percentile
1 650 
144 K
718 
87 080 
30th percentile
1 847 
157 K
770 
99 930 
40th percentile
2 201 
217 K
971 
116 K
50th percentile
2 329 
240 K
1 131 
120 K
60th percentile
2 686 
247 K
1 283 
123 K
70th percentile
2 742 
315 K
1 456 
134 K
80th percentile
2 928 
456 K
1 600 
141 K
90th percentile
3 190 
493 K
1 719 
174 K

National and departmental comparison

Evolution of the median price per m² of houses

Evolution of the median price per m² of apartments

Quarterly evolution

Evolution of the median price per m²

Evolution of the number of transactions

Quarterly data

Descending order
Quarter
Houses
house
transactions
Houses
house
Price per m²
Apartments
apt.
transactions
Apartments
apt.
Price per m²
2025 Q2
2
2 844 
1
1 234 
2025 Q1
0
--- 
1
702 
2024 Q4
1
2 800 
0
--- 
2024 Q2
2
1 480 
0
--- 
2023 Q4
1
2 639 
0
--- 
2023 Q3
4
2 523 
0
--- 
2022 Q4
3
2 130 
0
--- 
2022 Q3
4
1 500 
0
--- 
2022 Q2
2
2 863 
1
416 
2022 Q1
3
2 124 
0
--- 
2021 Q4
3
2 395 
0
--- 
2021 Q3
2
2 511 
0
--- 
2021 Q1
1
500 
0
--- 
2020 Q4
1
818 
0
--- 
2020 Q3
3
1 904 
0
--- 
2020 Q2
1
947 
2
1 580 
2020 Q1
2
2 610 
0
--- 
2019 Q4
1
1 491 
0
--- 
2019 Q3
2
2 409 
0
--- 
2019 Q2
1
958 
0
--- 
2019 Q1
3
1 934 
1
1 028 
2018 Q4
3
2 062 
0
--- 
2018 Q3
1
1 470 
0
--- 
2018 Q2
1
2 250 
1
741 
2018 Q1
1
1 992 
0
--- 
2017 Q4
2
1 414 
0
--- 
2017 Q3
1
1 231 
1
1 813 
2017 Q2
4
1 918 
1
2 448 
2017 Q1
2
1 816 
0
--- 
2016 Q4
1
1 813 
0
--- 
2016 Q2
4
1 230 
0
--- 
2015 Q4
2
984 
0
--- 
2015 Q3
1
1 228 
0
--- 
2015 Q2
2
1 148 
0
--- 
2015 Q1
3
2 526 
0
--- 
2014 Q4
2
1 298 
1
1 605 
2014 Q2
4
2 064 
0
--- 
2014 Q1
4
1 266 
0
--- 

Overview of the latest real estate transactions

The following list is an anonymized overview of the latest transactions. For more details and to find all transactions, please use the map to view transactions by plot or the transaction search page for a search by criteria.

2025-06-17
240 700 
1 234  /m²(195 m²)
Sale
Apartments
Apartment
3 rooms
63 m2
Apartments
Apartment
2 rooms
72 m2
Apartments
Apartment
2 rooms
60 m2
1 outbuilding
Land
385 m2
-Sols
2025-06-04
240 000 
2 727  /m²(88 m²)
Sale
Houses
House
3 rooms
88 m2
Land
150 m2
-Sols
2025-05-21
213 100 
2 960  /m²(72 m²)
Sale
Houses
House
2 rooms
72 m2
Land
102 m2
-Sols
Land
103 m2
-Jardins
2025-04-14
206 000 
492  /m²(419 m²)
696  /m²(296 m²)
Sale
Houses
House
4 rooms
131 m2
Houses
House
6 rooms
165 m2
Commercial property
123 m2
2025-04-09
1 200 
Sale
Land
1955 m2
-Terres
Land
524 m2
-Terres
Land
1572 m2
-Terres
Land
20 m2
-Sols
Land
120 m2
-Sols
2025-03-28
748 
Sale
Land
840 m2
-Landes
/Pâture plantée
2025-02-24
130 000 
Sale
Land
6890 m2
-Terres
2025-02-20
80 000 
702  /m²(114 m²)
Sale
Apartments
Apartment
2 rooms
50 m2
Apartments
Apartment
2 rooms
64 m2
1 outbuilding
2025-02-07
90 000 
Sale
Land
60 m2
-Sols
Land
60 m2
-Sols
2024-12-26
140 000 
2 800  /m²(50 m²)
Sale
Houses
House
3 rooms
50 m2
Land
50 m2
-Sols
Land
95 m2
-Jardins
2024-12-12
200 
Sale
Land
40 m2
-Terres
2024-04-30
159 800 
1 858  /m²(86 m²)
Sale
Houses
House
3 rooms
86 m2
Land
43 m2
-Sols
2024-04-08
54 000 
1 102  /m²(49 m²)
Sale
Houses
House
2 rooms
49 m2
Land
28 m2
-Sols
2024-03-26
115 000 
Sale
Land
225 m2
-Terres
Land
919 m2
-Terres
2023-12-13
475 000 
2 639  /m²(180 m²)
Sale
Houses
House
5 rooms
180 m2
Land
1560 m2
-Sols
Land
55 m2
-Terres
Land
270 m2
-Terres
2023-10-11
3 751 
Sale
Land
59 m2
-Jardins
2023-09-19
27 000 
Sale
Land
56050 m2
-Taillis simples
Land
6875 m2
-Taillis simples
2023-09-07
5 500 
Sale
Land
300 m2
-Landes
/Pâture plantée
Land
1650 m2
-Landes
/Pâture plantée
Land
7220 m2
-Terres
2023-09-05
617 900 
4 414  /m²(140 m²)
Sale
Houses
House
5 rooms
140 m2
3 outbuildings
Land
2045 m2
-Terres
Land
21 m2
-Sols
Land
479 m2
-Terres
2023-08-24
5 000 
Sale
Land
4450 m2
-Terres
181 transactions listed in the municipality

Drôme (26)

Most expensive cities

City
name
Descending orderHouses
house
Price per m²
3 880 
3 722 
3 404 
3 368 
3 361 
3 333 
3 314 
City
name
Descending orderApartments
apt.
Price per m²
9 900 
4 407 
3 265 
3 044 
2 987 
2 905 
2 872 

Least expensive cities

City
name
Ascending orderHouses
house
Price per m²
604 
769 
918 
1 000 
1 042 
1 058 
1 102 
1 120 
City
name
Ascending orderApartments
apt.
Price per m²
189 
303 
500 
583 
710 
718