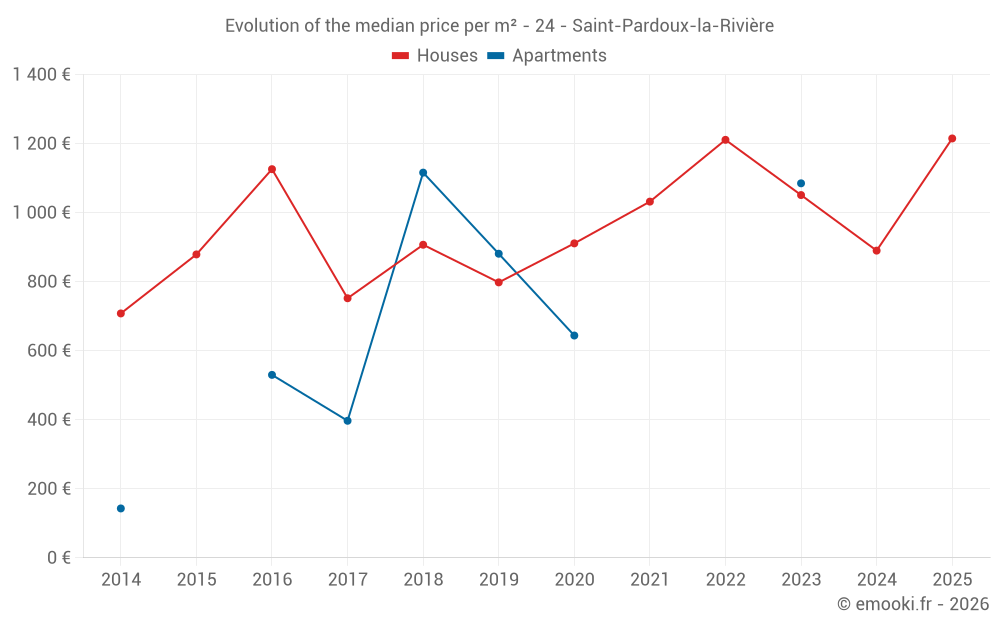
Median price of real estate
in the municipality of Saint-Pardoux-la-Rivière
Houses
1 165 € /m²
Reliability 8/10
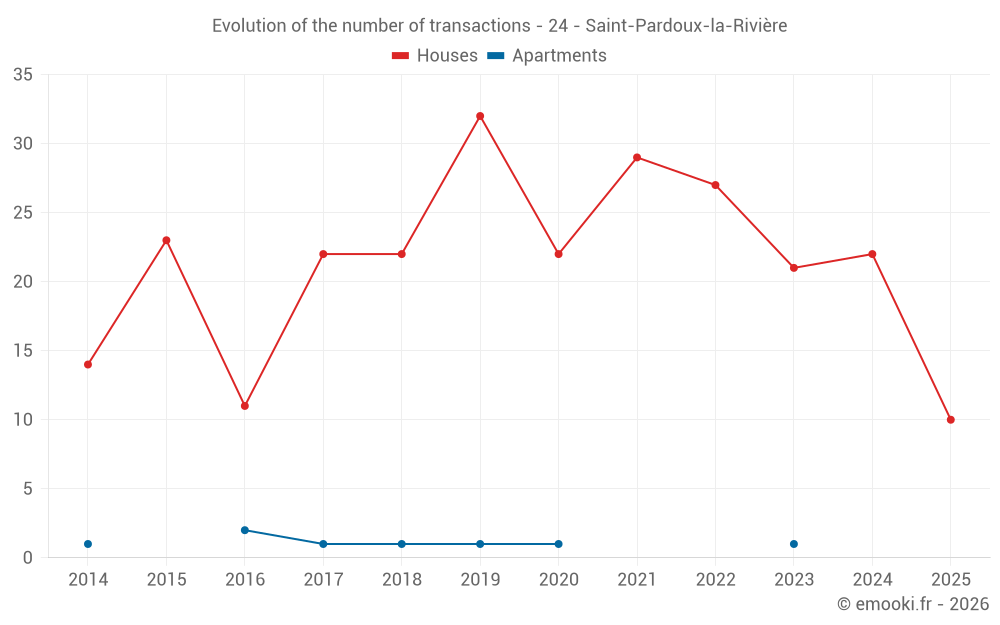
Median price on the 21 transactions of the last 12 months.
from 473 to
1 648 € /m²
1 648 € /m²
60% of transactions from the 2nd to the 8th deciles.
Apartments
881 € /m²
Reliability 2/10
Median price on the 5 transactions of the last 96 months.
Dwellings
1 165 € /m²
Reliability 8/10
Median price on the 21 transactions of the last 12 months.
from 473 to
1 648 € /m²
1 648 € /m²
60% of transactions from the 2nd to the 8th deciles.