emooki
HomePrice mapTransactions
🇬🇧 English🇫🇷 Français🇩🇪 Deutsch🇪🇸 Español🇮🇹 Italiano

Real estate price map


Real estate price map in the municipality of Périgueux.

Dordogne (24)
Périgueux

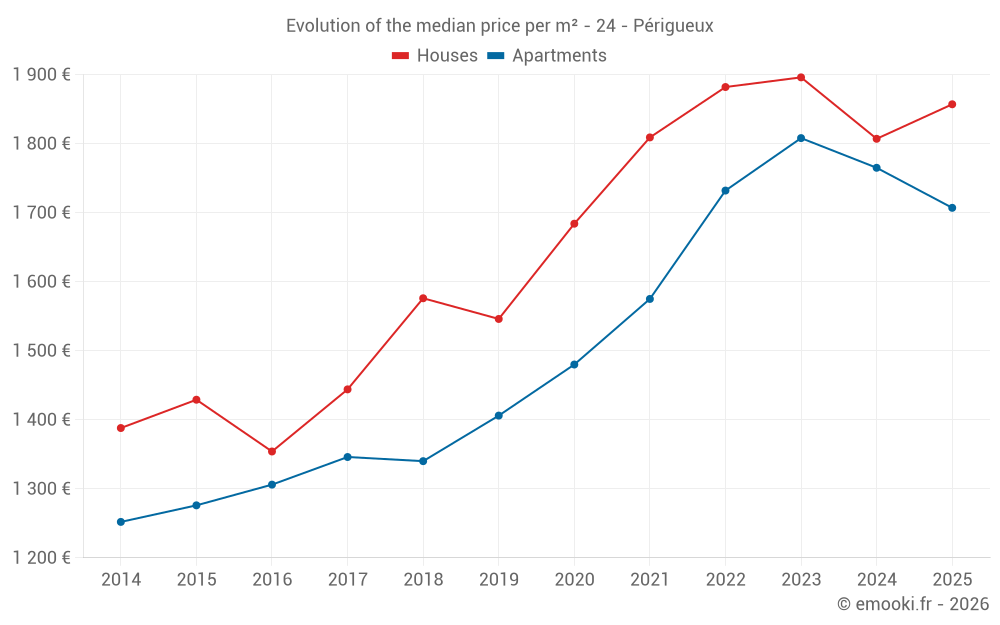
Median price of real estate
in the municipality of Périgueux

HousesHouses
1 857  /m²
1-23-45-67-89-10
Reliability 9/10
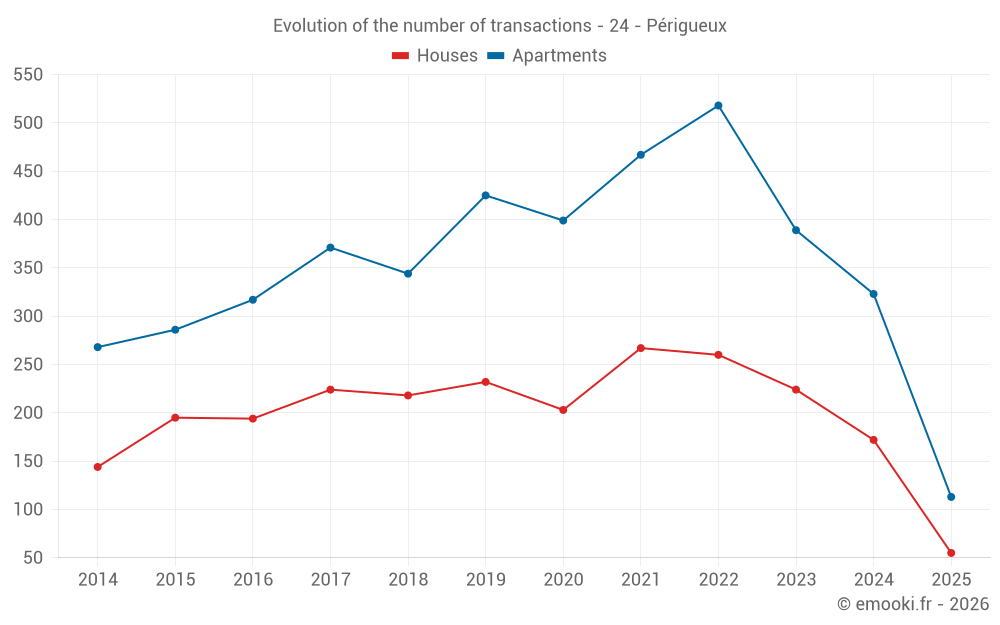
Median price on the 55 transactions of the last 6 months.
from 1 232 to
2 613  /m²
60% of transactions from the 2nd to the 8th deciles.
ApartmentsApartments
1 711  /m²
1-23-45-67-89-10
Reliability 10/10
Median price on the 20 transactions of the last 3 months.
from 1 278 to
2 042  /m²
60% of transactions from the 2nd to the 8th deciles.
DwellingsDwellings
1 734  /m²
1-23-45-67-89-10
Reliability 10/10
Median price on the 28 transactions of the last 3 months.
from 1 233 to
2 142  /m²
60% of transactions from the 2nd to the 8th deciles.
HousesEvolution of the price per m² of houses since...
1 year
+2.8%
2 years
-2.1%
3 years
-1.3%
4 years
+2.7%
5 years
+10%
6 years
+20%
7 years
+18%
8 years
+29%
9 years
+37%
10 years
+30%
11 years
+34%
ApartmentsEvolution of the price per m² of apartments since...
1 year
-3.3%
2 years
-5.6%
3 years
-1.4%
4 years
+8.4%
5 years
+15%
6 years
+21%
7 years
+27%
8 years
+27%
9 years
+31%
10 years
+34%
11 years
+36%

Yearly evolution

Evolution of the median price per m²

Evolution of the number of transactions

Warning, last year incomplete. Projections made based on the proportions between semesters of the previous year at the departmental/national level and by type of property.

Yearly data

Descending order
Year
Houses
house
transactions
Houses
house
Price per m²
Apartments
apt.
transactions
Apartments
apt.
Price per m²
2025
55
1 857 
113
1 707 
2024
172
1 807 
323
1 765 
2023
224
1 896 
389
1 808 
2022
260
1 882 
518
1 732 
2021
267
1 809 
467
1 575 
2020
203
1 684 
399
1 480 
2019
232
1 546 
425
1 406 
2018
218
1 576 
344
1 340 
2017
224
1 444 
371
1 346 
2016
194
1 354 
317
1 306 
2015
195
1 429 
286
1 276 
2014
144
1 388 
268
1 252 

Analysis

Structure of prices per m²

Values of price percentiles per m² over the periods used for the estimated price of each type of property.

Structure of transaction amounts

Values of transaction amounts percentiles over the periods used for the estimated price of each type of property.

Transaction amounts and prices per m² by percentile

Ascending order
Percentile
Houses
house
Price per m²
Houses
house
Transaction amount
Apartments
apt.
Price per m²
Apartments
apt.
Transaction amount
10th percentile
1 096 
89 000 
1 160 
42 812 
20th percentile
1 232 
110 K
1 278 
73 200 
30th percentile
1 543 
134 K
1 321 
87 700 
40th percentile
1 749 
165 K
1 610 
110 K
50th percentile
1 857 
180 K
1 711 
124 K
60th percentile
2 160 
190 K
1 749 
131 K
70th percentile
2 406 
219 K
1 854 
139 K
80th percentile
2 613 
271 K
2 042 
189 K
90th percentile
2 964 
328 K
2 521 
204 K

National and departmental comparison

Evolution of the median price per m² of houses

Evolution of the median price per m² of apartments

Quarterly evolution

Evolution of the median price per m²

Evolution of the number of transactions

Quarterly data

Descending order
Quarter
Houses
house
transactions
Houses
house
Price per m²
Apartments
apt.
transactions
Apartments
apt.
Price per m²
2025 Q2
8
1 822 
20
1 711 
2025 Q1
47
1 883 
93
1 707 
2024 Q4
44
1 800 
95
1 765 
2024 Q3
56
1 820 
88
1 654 
2024 Q2
42
1 802 
78
1 864 
2024 Q1
30
1 820 
62
1 755 
2023 Q4
61
1 882 
86
1 734 
2023 Q3
51
2 027 
98
1 754 
2023 Q2
54
1 830 
106
1 902 
2023 Q1
58
2 034 
99
1 842 
2022 Q4
65
1 982 
125
1 860 
2022 Q3
79
2 025 
141
1 720 
2022 Q2
54
1 653 
141
1 750 
2022 Q1
62
1 864 
111
1 707 
2021 Q4
69
1 895 
115
1 635 
2021 Q3
78
1 992 
135
1 625 
2021 Q2
63
1 790 
129
1 557 
2021 Q1
57
1 786 
88
1 481 
2020 Q4
57
1 769 
129
1 444 
2020 Q3
40
1 802 
97
1 542 
2020 Q2
55
1 634 
93
1 485 
2020 Q1
51
1 486 
80
1 411 
2019 Q4
59
1 568 
135
1 370 
2019 Q3
74
1 556 
116
1 465 
2019 Q2
46
1 549 
90
1 382 
2019 Q1
53
1 475 
84
1 393 
2018 Q4
48
1 628 
86
1 328 
2018 Q3
62
1 634 
85
1 333 
2018 Q2
59
1 443 
86
1 326 
2018 Q1
49
1 627 
87
1 347 
2017 Q4
46
1 435 
69
1 324 
2017 Q3
64
1 311 
94
1 333 
2017 Q2
53
1 500 
105
1 352 
2017 Q1
61
1 618 
103
1 429 
2016 Q4
53
1 360 
78
1 293 
2016 Q3
49
1 351 
86
1 250 
2016 Q2
55
1 333 
88
1 417 
2016 Q1
37
1 366 
65
1 364 
2015 Q4
62
1 398 
84
1 390 
2015 Q3
64
1 414 
70
1 250 
2015 Q2
38
1 362 
62
1 181 
2015 Q1
31
1 528 
70
1 198 
2014 Q4
33
1 410 
80
1 253 
2014 Q3
38
1 357 
76
1 186 
2014 Q2
37
1 358 
62
1 282 
2014 Q1
36
1 512 
50
1 323 

Dordogne (24)

Most expensive cities

City
name
Descending orderHouses
house
Price per m²
2 859 
2 736 
2 487 
2 476 
2 469 
2 422 
2 413 
2 402 
City
name
Descending orderApartments
apt.
Price per m²
3 869 
3 292 
2 239 
2 174 
2 023 
1 916 
1 886 

Least expensive cities

City
name
Ascending orderHouses
house
Price per m²
778 
811 
812 
813 
City
name
Ascending orderApartments
apt.
Price per m²
182 
198 
242 
250